
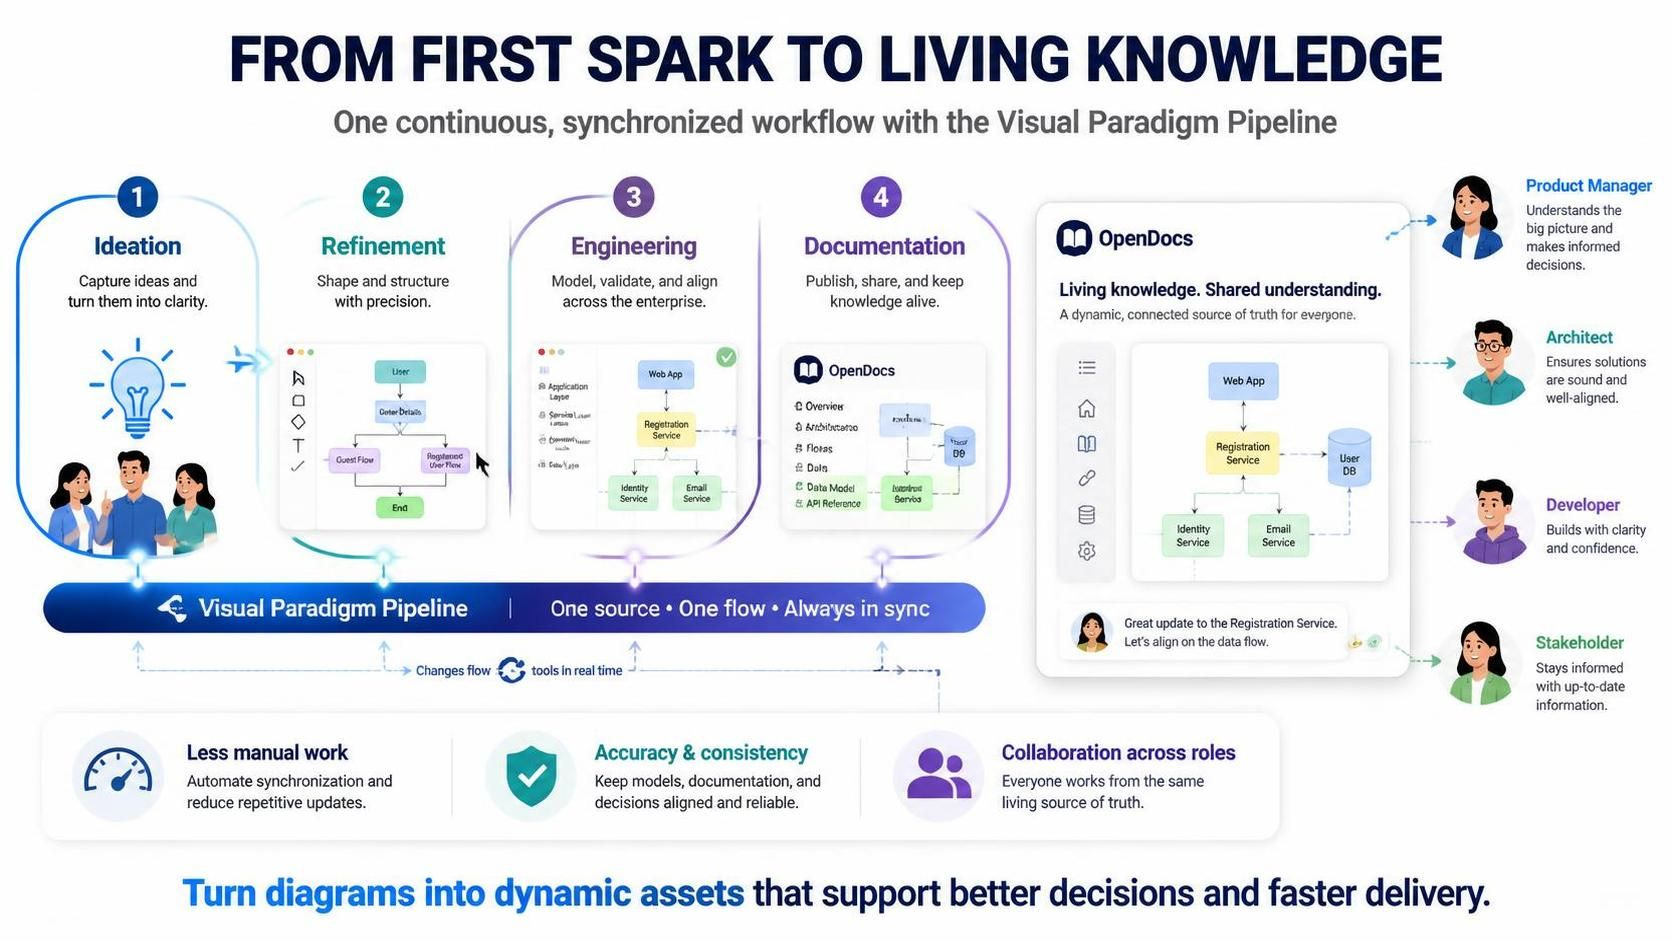
In the modern software development lifecycle (SDLC), the gap between high-level business strategy and low-level engineering implementation is often bridged by static, outdated documentation. The Visual Paradigm AI Ecosystem challenges this norm by introducing a continuous, synchronized workflow. This tutorial explores how the Visual Paradigm Pipeline transforms diagramming from a static, manual task into a dynamic, “living” asset that evolves with your project.
1. The Concept of “Living Knowledge”
The core philosophy behind this ecosystem is the concept of Living Knowledge. Traditional modeling tools often result in “documentation debt,” where diagrams are created once, forgotten, and become disconnected from the actual code. By integrating the Visual Paradigm Pipeline with OpenDocs, the system ensures that a single source of truth exists throughout the entire process—from the initial spark of an idea to the final publication.
2. The Four-Step Workflow Architecture
The architecture is designed around four distinct but interconnected phases. Each phase leverages specific modeling techniques to add value at that stage of development.
Phase 1: Ideation (Capture Ideas)
The journey begins with the Ideation phase. In this stage, Product Managers and Architects capture the initial “spark” of an idea. The focus here is on clarity and high-level conceptualization rather than technical precision.
- Goal: Turn abstract concepts into visual clarity.
- Key Activity: Brainstorming and rough sketching of processes or user journeys.
- Role: Product Managers and Stakeholders collaborate to define the “What” and “Why.”
Phase 2: Refinement (Structure with Precision)
Once an idea is captured, it moves to Refinement. This is where the workflow introduces structure. The raw idea is transformed into a defined model. The interface shown in the pipeline suggests the use of standard modeling tools to define flows and structures.
- Goal: Shape and structure the idea with precision.
- Key Activity: Creating formal diagrams such as BPMN (Business Process Model and Notation) or flowcharts.
- Technical Note: This is where “Guest Flows” or specific user journeys (e.g., “Register User Flow”) are defined, ensuring that the logic is sound before moving to engineering.
Phase 3: Engineering (Model, Validate, Align)
The pipeline then feeds into Engineering. This phase is critical for bridging the gap between design and code. The system allows for the modeling of application layers and services.
- Goal: Model, validate, and align technical specifications.
- Key Activity: Defining the Application Layer, Service Layer, and Database Layer.
- Components: The diagram illustrates specific services like Registration Service, Identity Service, and Email Service, connected to a Web App and User DB.
- Validation: The “checkmark” icon in the workflow suggests automated validation or alignment checks to ensure the model matches the intended architecture.
Phase 4: Documentation (Publish & Share)
The final phase is Documentation, powered by OpenDocs. Instead of exporting static images or PDFs, the system publishes the model as a dynamic, connected source of truth.
- Goal: Publish, share, and keep knowledge alive.
- Key Output: An interactive documentation portal that includes an Overview, Architecture, Flows, Data, and API Reference.
- Real-time Updates: As engineers update the model in Phase 3, the OpenDocs documentation updates automatically, ensuring stakeholders always see the current state.
3. The Role of the Visual Paradigm Pipeline
The Visual Paradigm Pipeline acts as the central nervous system of this architecture. It enforces a “One Source, One Flow” policy. This eliminates the silos where developers work on code that no longer matches the architects’ diagrams.
The pipeline facilitates the following synchronization:
- Changes flow in real time: Updates made in the modeling tool immediately reflect in the documentation.
- Collaboration across roles: Whether you are a Developer building the Email Service or a Product Manager reviewing the Registration Flow, everyone is looking at the same synchronized data.
4. Impact on Decision Making
By adopting this ecosystem, organizations transform diagrams from static artifacts into dynamic assets. This leads to:
- Less Manual Work: Automation handles synchronization and repetitive updates.
- Accuracy & Consistency: Models, documentation, and decisions remain aligned.
- Faster Delivery: Teams spend less time updating docs and more time delivering features.