
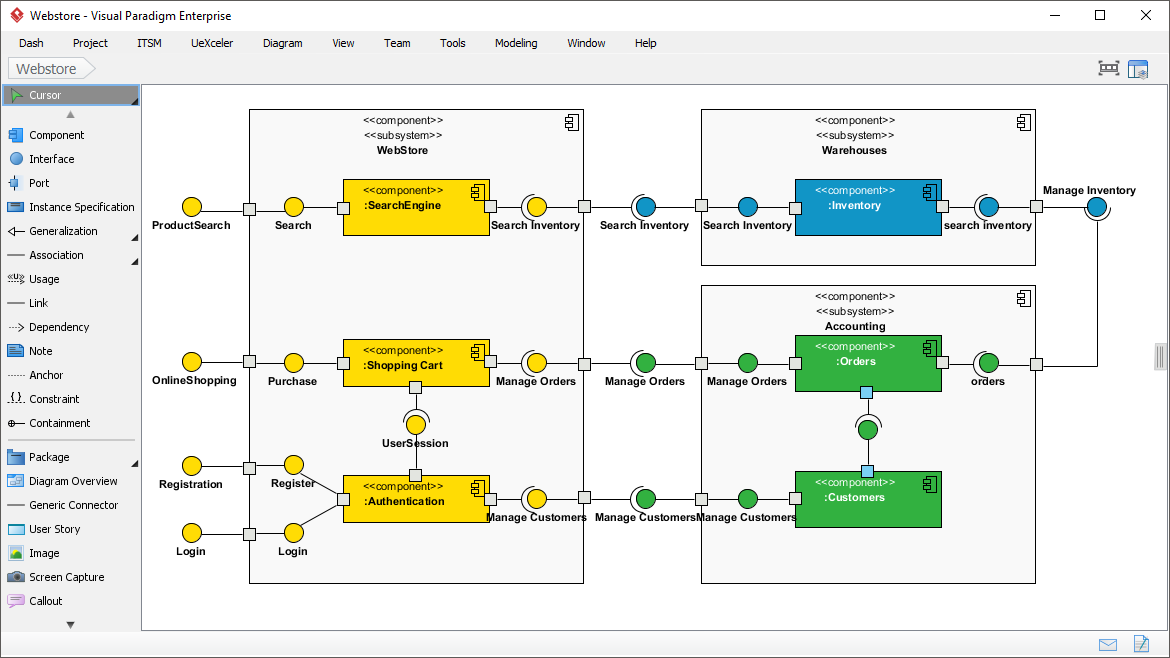
In the complex world of software engineering, understanding how a system is built is just as critical as understanding what the system does. This is where the Component Diagram becomes an indispensable tool. Unlike Class Diagrams that focus on data structure, or Sequence Diagrams that focus on time-based interactions, a Component Diagram provides a high-level view of the physical building blocks of your software.
As we examine the architecture of a typical “Webstore” application, we can see how modular design principles are applied to create a system that is both robust and maintainable. This tutorial will guide you through the anatomy of component diagrams, the critical concept of Interfaces, and how Visual Paradigm helps you visualize these critical architectural decisions.
What is a Component Diagram?
A Component Diagram is a UML (Unified Modeling Language) behavioral diagram used to model the physical parts of a software system. It illustrates how larger components are built from smaller ones and how they interface with each other. Think of it as the blueprint for your software’s engine room.
In a modern architecture, such as microservices or modular monoliths, these “components” might represent:
- Microservices: Independent services like Authentication or Inventory.
- Libraries: Reusable code packages that provide specific functionality.
- Database Systems: The underlying storage engines.
Anatomy of the Webstore Architecture
Let’s break down the specific components and relationships shown in the Webstore example. This diagram effectively separates the system into two distinct domains: the Frontend/Web Store and the Backend Services.
1. The WebStore Domain
The left side of the diagram represents the public-facing application. It contains the logic that directly interacts with the user. Key components here include:
- :Shopping Cart: Manages the items a user intends to buy. It requires a Search Inventory interface to verify stock and a Manage Orders interface to finalize purchases.
- :Authentication: Handles user identity. It exposes interfaces for Login and Register, ensuring secure access before a user can interact with the cart.
- :SearchEngine: The component responsible for product discovery. It exposes the ProductSearch interface.
2. The Backend Services Domain
The right side of the diagram represents the heavy-lifting services that support the webstore. These are often physically separated from the frontend.
- Warehouses: A subsystem containing the :Inventory component. This is the “source of truth” for stock levels. It exposes a Search Inventory interface to the shopping cart and a Manage Inventory interface to update stock.
- Accounting: A subsystem handling financial and relational data. It includes the :Orders component (processing transactions) and the :Customers component (managing user profiles).
The Power of Interfaces: “Lollipop” vs. “Socket”
The most critical concept in this diagram is how components communicate without knowing the internal secrets of one another. This is achieved through Interfaces.
In the diagram, you will notice two distinct shapes:
- The Lollipop (Provided Interface): This is a circle shape attached to a component (e.g., :Authentication providing the Register service). It signifies, “I am offering this functionality to anyone who needs it.”
- The Socket (Required Interface): This is a half-circle shape (e.g., :Shopping Cart requiring the Search Inventory service). It signifies, “I need this functionality to do my job.”
When a Socket connects to a Lollipop, it creates a contract. The Shopping Cart doesn’t need to know how the Inventory system calculates stock; it only needs to know how to ask for it via the Search Inventory interface. This decoupling is the foundation of scalable software.
Modeling Modular Structure
Notice the larger boxes labeled <<subsystem>> (e.g., Warehouses, Accounting). These are not just visual containers; they represent logical grouping. In a real-world deployment, the “Warehouses” subsystem might be hosted on a completely different server cluster than the “WebStore.”
By using subsystems, you can:
- Manage Complexity: Hide the internal details of a complex service.
- Define Boundaries: Clearly delineate which team owns which part of the system.
- Visualize Deployment: Prepare for deployment strategies where different components are distributed across different nodes.
Tooling: Visual Paradigm
To create professional-grade diagrams like the one shown here, using the right tool is essential. Visual Paradigm is a comprehensive modeling tool that supports the full spectrum of UML diagrams, including Component Diagrams.
Visual Paradigm makes the process of connecting components intuitive. Its palette allows you to drag and drop Component shapes, Interface shapes, and Subsystems. The software automatically handles the complex geometry of connecting the “sockets” to the “lollipops,” ensuring your diagram is not only visually accurate but also semantically correct.
Furthermore, Visual Paradigm supports reverse engineering, meaning you can import existing code (like Java or C#) to automatically generate component diagrams, or export your diagrams into actual code skeletons. This bidirectional flow ensures your documentation remains synchronized with your actual software development.