Cloud-native architectures introduce a level of complexity that traditional monolithic systems never faced. When designing distributed systems, understanding the runtime state of components is just as critical as understanding their static definitions. This is where UML Object Diagrams become an essential tool for architects and engineers. Unlike class diagrams which define blueprints, object diagrams capture snapshots of actual instances at a specific moment in time.
In the context of cloud-native development, these snapshots provide clarity on how microservices interact, how containers manage state, and how data flows through ephemeral environments. This guide explores the practical application of object modeling in modern infrastructure, focusing on static structure, relationships, and lifecycle management without relying on vendor-specific terminology.
🏗️ Understanding the Object Diagram Distinction
Before diving into cloud-specific applications, it is necessary to distinguish between the Class Diagram and the Object Diagram. While both are static structure diagrams in Unified Modeling Language (UML), they serve different purposes.
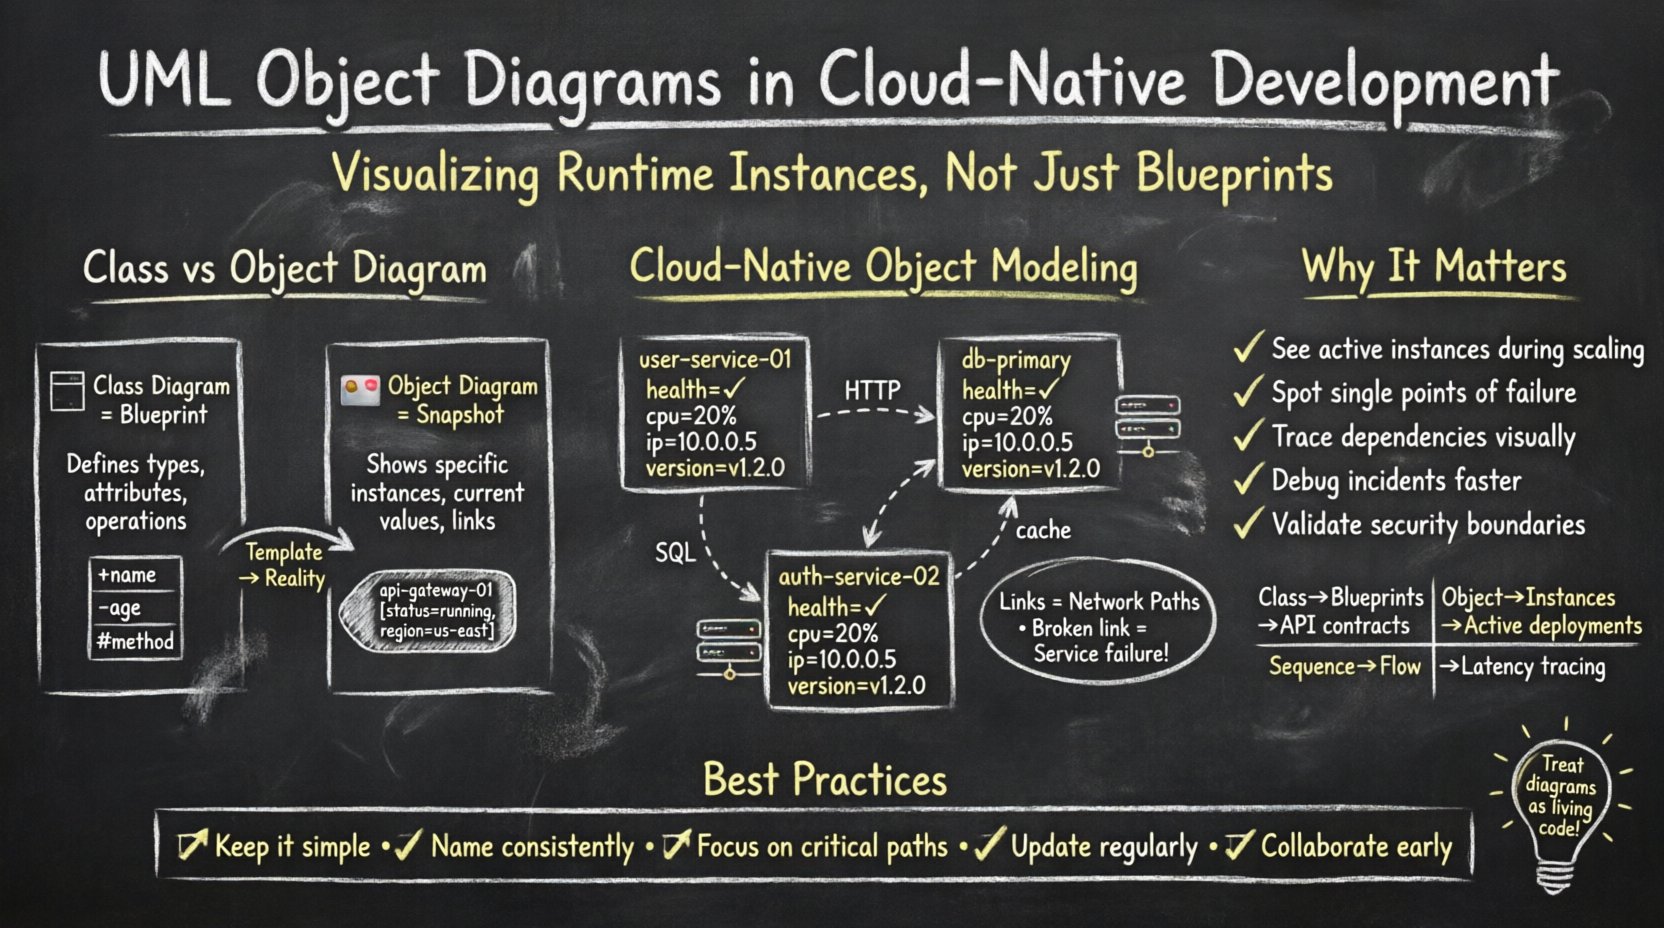
- Class Diagram: Defines the types, attributes, and operations available. It is the template.
- Object Diagram: Defines specific instances, their current values, and the links between them. It is the snapshot.
In a cloud environment, the class diagram might describe a generic Service type with methods like start() or stop(). The object diagram, however, shows three specific instances of that service running across different nodes, with specific IP addresses, memory allocations, and connection states.
Why This Matters in Cloud-Native Systems
Cloud-native development relies heavily on dynamic scaling and statelessness. The ephemeral nature of containers means that instances are created and destroyed frequently. An object diagram helps visualize the state of the system during a specific event, such as a deployment or a scaling operation. It answers questions like:
- How many active instances exist right now?
- Are they connected to the database correctly?
- Is the load balancer routing traffic to healthy nodes?
📊 Modeling Microservice Instances
When modeling microservices, the object diagram shifts focus from the code structure to the deployment topology. Each object represents a running process or a containerized unit.
Key Elements to Include
- Instance Names: Clearly label objects (e.g., api-gateway-01, user-service-03).
- Attribute Values: Show current configuration states, such as status=running or region=us-east.
- Links: Represent network connections, API calls, or data pipelines between instances.
Consider a scenario where an authentication service communicates with a user database. The object diagram would show the specific instance of the auth service and the specific instance of the database it is currently querying. This visualizes the dependency chain without needing to trace logs.
Static vs. Dynamic Views
Object diagrams are static. They do not show the flow of data over time, but they show the potential for interaction. In cloud-native contexts, this static view helps identify bottlenecks. For example, if one database instance object is linked to five different application service objects, that node is a potential single point of failure.
| Diagram Type | Focus | Cloud-Native Use Case |
|---|---|---|
| Class Diagram | Blueprints | Defining API contracts |
| Object Diagram | Instances | Visualizing active deployments |
| Sequence Diagram | Interaction Flow | Tracing request latency |
| Deployment Diagram | Infrastructure | Mapping nodes and hardware |
🔄 Container State and Lifecycle Representation
Containers are ephemeral. They are designed to be short-lived. However, during their lifecycle, they hold state. An object diagram can capture this transient state to aid in debugging and capacity planning.
State Attributes
When modeling a container instance, include attributes that reflect its operational state:
- Health Status: healthy, unhealthy, starting.
- Resource Usage: cpu=20%, memory=512MB.
- Network Address: ip=10.0.0.5.
- Version: image-tag=v1.2.0.
By documenting these attributes, teams can create a baseline for what a healthy instance looks like. When an object diagram reveals an instance with status=starting for an extended period, it flags a potential issue.
Orchestration and Scaling
Cloud platforms often use orchestration engines to manage these objects. When a scaling event occurs, the number of objects increases. An object diagram helps visualize the target state after scaling.
For example, if a system scales from 2 instances to 10, the diagram shows the distribution of load. Are all 10 instances linked to the same backend? Are they distributed across different failure domains? The diagram forces the architect to think about connectivity before the code is written.
🔗 Relationships and Links
Links in an object diagram represent associations between objects. In cloud-native development, these links are critical because they represent network paths. A broken link implies a service failure.
Types of Links
- Communication: HTTP/REST calls between services.
- Data Access: Direct database queries or cache hits.
- Dependency: Configuration service lookups.
It is important to label these links with their cardinality. For instance, one load balancer object might link to multiple backend service objects. This is typically a 1-to-Many relationship. Conversely, a specific database transaction might link to exactly one service instance (1-to-1).
Identifying Circular Dependencies
One of the most common issues in distributed systems is circular dependencies. Service A calls Service B, and Service B calls Service A. An object diagram makes these loops visually apparent. If you draw the links between the specific instances, a cycle becomes obvious, allowing the team to refactor the architecture before deployment.
⚙️ Configuration and Dependency Injection
Modern applications rely heavily on configuration management and dependency injection. In an object diagram, these relationships are often implicit but should be made explicit to ensure clarity.
External Dependencies
Services often depend on external resources like message queues, object storage, or third-party APIs. The object diagram should show these external systems as objects as well.
- Message Queue: queue-service-01
- Storage Bucket: blob-store-primary
- Cache Layer: redis-cluster-node
By including these in the diagram, you acknowledge that the system’s stability depends on these external objects. If the storage object is marked as offline, the application objects linked to it cannot function correctly.
Environment Specifics
Configuration often varies by environment (Development, Staging, Production). An object diagram can be created for each environment to highlight the differences.
- Development: Single instance, mocked external services.
- Production: Multiple instances, redundant external services, load balancers.
This separation helps prevent configuration drift. It ensures that the production topology is documented and understood, reducing the risk of deploying a simplified development topology to a live environment.
🛠️ Operational Debugging and Incident Response
When an incident occurs, engineers need to understand the state of the system. An object diagram serves as a reference point for the expected state. Comparing the current state against the diagram can speed up root cause analysis.
Step-by-Step Debugging
- Identify the Failing Object: Locate the instance showing an error state.
- Trace Incoming Links: Check which services are sending traffic to it.
- Trace Outgoing Links: Check which downstream services are not receiving data.
- Verify Configuration: Ensure the instance attributes match the expected values.
This structured approach reduces the cognitive load during high-pressure situations. Instead of guessing, the team follows the map provided by the diagram.
📉 Scaling and Replication Strategies
Scaling is a core tenet of cloud-native development. Horizontal scaling involves adding more instances of the same service. Object diagrams help visualize the replication strategy.
Active-Active vs. Active-Passive
The diagram can illustrate the difference between these two strategies.
- Active-Active: Multiple instances of the same service are linked to the load balancer simultaneously. All handle traffic.
- Active-Passive: One instance is active, others are standby. The diagram shows the active instance with a different link weight or status.
Understanding this distinction in the diagram helps clarify the failover logic. If the active instance fails, does the system automatically switch to a standby? The diagram should reflect this potential transition.
🛡️ Security and Access Control
Security is not just about encryption; it is about access control between components. Object diagrams can model the trust relationships between instances.
Trust Boundaries
Not all instances should talk to all instances. The diagram should show which services are authorized to communicate.
- Frontend: Should only talk to the API Gateway.
- API Gateway: Should talk to the Service Layer.
- Service Layer: Should talk to the Database and Cache.
If an object diagram shows a direct link from the Frontend to the Database, it indicates a security violation. The architecture diagram validates the security model before code is written.
📝 Maintenance and Documentation Strategy
One of the biggest challenges with object diagrams is keeping them up to date. Cloud-native systems change frequently. Static diagrams can become obsolete quickly.
Automated Documentation
To maintain accuracy, consider generating diagrams from the infrastructure-as-code definitions. If the deployment configuration is version-controlled, the object diagram can be derived from that configuration.
- Version Control: Store diagram definitions alongside code.
- CI/CD Integration: Regenerate diagrams during the build process to ensure they match the deployed state.
- Review Process: Include diagram updates in the pull request review process.
Limitations to Acknowledge
While powerful, object diagrams have limitations. They do not show time-based behavior. They do not show performance metrics like latency or throughput. They are a structural tool, not a performance tool. Teams must use them in conjunction with monitoring and tracing tools for a complete picture.
🎯 Best Practices for Implementation
To get the most value from UML object diagrams in cloud-native development, follow these guidelines.
- Keep it Simple: Do not try to model every single instance in a large cluster. Model representative instances.
- Use Consistent Naming: Ensure object names match the deployment naming conventions used in the platform.
- Focus on Critical Paths: Prioritize diagramming the data paths that are most critical to business logic.
- Update Regularly: Treat diagrams as living documents that evolve with the system.
- Collaborate: Use diagrams during design reviews to align developers, ops, and security teams.
🚀 Integrating with the Development Lifecycle
Incorporating object diagrams into the development lifecycle ensures that architectural decisions are made with a clear understanding of the runtime environment.
Design Phase
During the design phase, object diagrams help define the target architecture. They force the team to think about how many instances are needed and how they connect. This prevents the assumption that a single instance can handle all traffic.
Implementation Phase
During implementation, developers can reference the diagram to understand how their code fits into the broader system. It clarifies which services they need to call and what data they need to expose.
Testing Phase
In the testing phase, the diagram helps define test scenarios. If the diagram shows a dependency on a specific database instance, the test suite should include checks for connectivity to that instance.
🔍 Common Pitfalls to Avoid
Even with best practices, there are common mistakes that reduce the value of these diagrams.
- Over-Modeling: Trying to model every single microservice in a large ecosystem leads to clutter. Focus on the core services.
- Ignoring State: Focusing only on connectivity without considering state (e.g., session data) can lead to incorrect assumptions about scalability.
- Static Assumptions: Assuming the topology never changes. Cloud-native systems are dynamic; the diagram should reflect the potential for change.
- Vendor Lock-in: Avoid using diagrams that rely on specific vendor features. Keep the modeling generic to ensure portability.
📌 Summary of Key Takeaways
UML object diagrams provide a concrete way to visualize the runtime state of cloud-native systems. They bridge the gap between abstract code and physical infrastructure. By focusing on instances, attributes, and links, teams can better understand scaling, failure modes, and connectivity.
When used correctly, these diagrams reduce ambiguity during design and speed up troubleshooting during operations. They are not a replacement for monitoring tools, but they complement them by providing a structural baseline. As systems grow in complexity, the need for clear, static representations of dynamic systems becomes more critical.
Adopting this practice requires discipline. Diagrams must be maintained. They must be treated as code. But the payoff is a more resilient, understandable, and maintainable cloud-native architecture.
🔗 Final Thoughts on Architecture Visualization
The journey of building cloud-native applications is one of managing complexity. Object diagrams offer a way to simplify that complexity. They allow teams to see the forest and the trees simultaneously. By understanding the specific instances and their relationships, engineers can build systems that are robust, scalable, and reliable.
Start small. Model your core services. Add complexity as the system grows. Keep the diagrams accurate. In doing so, you ensure that your architecture remains visible and manageable, regardless of how many containers are running.