Software systems grow in complexity over time. As features expand and data structures multiply, the architecture can become difficult to trace. Visualizing the static structure of a system is essential for clarity. One specific tool stands out for capturing a snapshot of a system at a particular moment: the UML Object Diagram. These diagrams provide a concrete view of how instances interact, distinct from the abstract blueprints of class diagrams.
Understanding these diagrams allows architects and developers to see the actual state of data flow within a specific context. This guide explores how to use object diagrams to clarify system behavior, reduce ambiguity, and ensure alignment across technical and non-technical teams. We will cover the components, syntax, usage scenarios, and best practices required to implement this modeling technique effectively.
What is an Object Diagram? 📋
An Object Diagram is a static structure diagram in the Unified Modeling Language (UML). It shows a complete or partial view of the structure of a modeled system at a specific point in time. While a Class Diagram describes the types of objects and the relationships between them, an Object Diagram describes the instances of those classes.
Key Characteristics
- Runtime Snapshot: It represents the system state as it exists at a specific moment, rather than the potential structure.
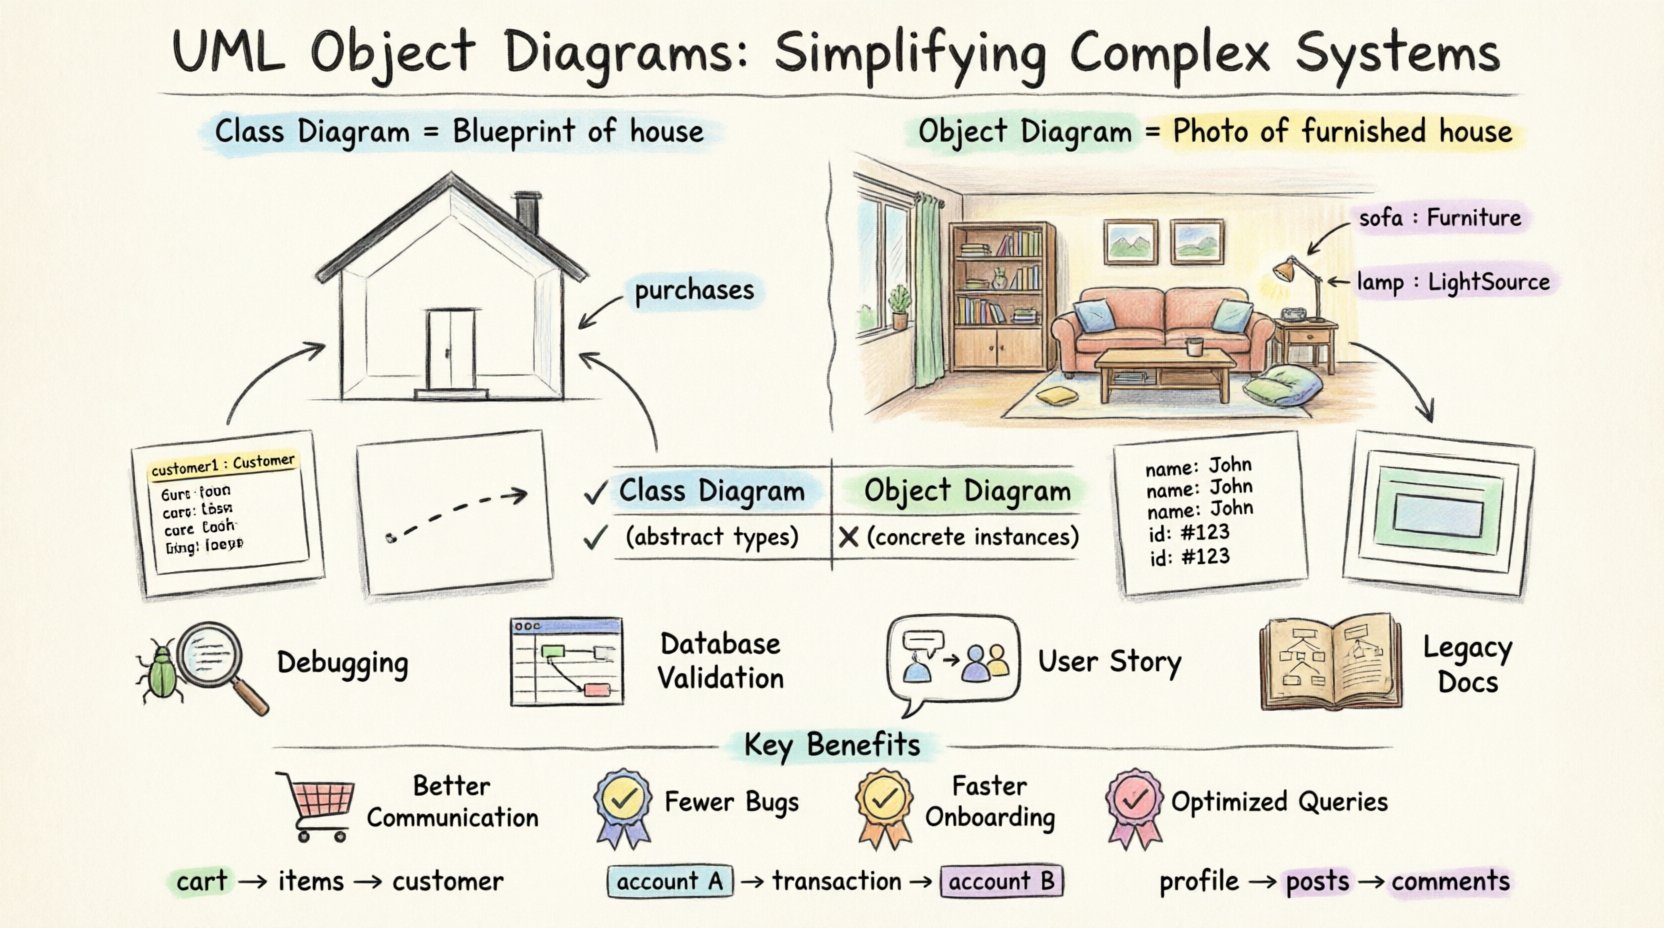
- Concrete Examples: Instead of showing a generic “User” class, it shows “user123” with specific attributes like “name: John”.
- Link Visualization: It explicitly displays the links (associations) between specific object instances.
- Simplicity: It strips away methods and behaviors to focus purely on data relationships.
Think of a Class Diagram as a blueprint for a house. It shows where walls go and what rooms exist. An Object Diagram is a photo of the house after it has been built and furnished. It shows exactly which furniture is in which room at that moment.
Core Components of an Object Diagram 🏗️
To construct an accurate object diagram, one must understand the fundamental elements that make up the visual representation. Each component serves a specific purpose in defining the system state.
1. Object Instances
Objects are the building blocks. They are instances of a class. In the diagram, they appear as rectangles.
- Notation: The object name is usually underlined to distinguish it from a class name.
- Format:
objectName : ClassNameor simplyobjectName. - Attributes: Specific values for attributes of the object are often listed inside the rectangle below the name.
Example: customer1 : Customer
2. Links (Associations)
Links represent the relationship between two objects. They are the connectors that show how data is connected at runtime.
- Direction: Arrows can indicate the direction of the relationship or navigability.
- Labels: Links can be named to describe the nature of the connection (e.g., “purchases”, “owns”, “manages”).
- Multiplicity: Constraints on the number of objects linked together are often shown near the ends of the link.
3. Classifiers
While the diagram focuses on instances, the underlying classes (Classifiers) define the structure. The type of the object is crucial for understanding what data it holds.
4. Nested Objects
Sometimes, an object contains another object as an attribute. This is represented by drawing the inner object inside the outer object’s rectangle.
Object Diagram vs. Class Diagram 🆚
Confusion often arises between Class Diagrams and Object Diagrams because both deal with structure. However, their utility differs based on the stage of the system lifecycle and the level of abstraction required.
| Feature | Class Diagram | Object Diagram |
|---|---|---|
| Focus | Types and potential structure | Instances and actual state |
| Scope | Static, general-purpose | Static, time-specific snapshot |
| Attributes | Attribute names and types | Attribute values (data) |
| Usage | Design phase, database schema | Debugging, documentation, runtime analysis |
| Complexity | Lower (fewer elements) | Higher (more specific elements) |
When to Use Object Diagrams 🕒
Using an object diagram is not necessary for every project. It is a specialized tool best applied in specific scenarios where understanding the concrete state of data is critical.
1. Debugging Complex Interactions
When a system behaves unexpectedly, developers can draw an object diagram of the state at the moment of failure. This helps trace how specific instances are linked and which attributes hold unexpected values.
2. Database Schema Validation
Before deploying to production, an object diagram can validate that the data relationships match the intended schema. It ensures that foreign keys and associations are correctly populated.
3. User Story Visualization
For business stakeholders, abstract class diagrams can be confusing. An object diagram showing a specific “Customer Order” scenario makes the data flow tangible and easier to understand.
4. Legacy System Documentation
For systems where code is outdated or poorly documented, object diagrams help reverse-engineer the current state of the data architecture.
Creating an Object Diagram: Step-by-Step Guide 🛠️
Building a robust object diagram requires a disciplined approach. Follow these steps to ensure accuracy and clarity.
- Identify the Scenario: Determine which part of the system you are modeling. Is it the login process? The checkout flow? The dashboard load?
- List the Classes Involved: Refer to the Class Diagram to identify the relevant classes (e.g., User, Order, Product).
- Create Instances: Instantiate the classes. Give them unique names (e.g.,
order_554). - Assign Attribute Values: Fill in the specific data for this scenario. Use realistic data types.
- Draw Links: Connect the instances according to the associations defined in the class structure.
- Add Multiplicity: Indicate how many objects can be linked to a single object.
- Review and Refine: Check for orphaned objects or links that violate constraints.
Common Mistakes to Avoid ⚠️
Even experienced modelers can make errors when creating object diagrams. Being aware of these pitfalls helps maintain the integrity of the documentation.
- Mixing Levels of Abstraction: Do not mix class names with object names. Keep them distinct.
- Ignoring Lifecycle: Objects have states (created, active, deleted). Ensure the diagram reflects the correct lifecycle stage.
- Over-Complicating: An object diagram for a massive system can become unreadable. Focus on a single subsystem or interaction.
- Static Links Only: Remember that links are also dynamic. Some links might only exist temporarily during a transaction.
- Missing Multiplicity: Failing to show how many instances can be associated leads to ambiguity in database constraints.
Integrating with Other UML Diagrams 🔄
An object diagram does not exist in isolation. It complements other diagrams in the UML suite to provide a complete picture of the system.
Sequence Diagrams
Sequence diagrams show the flow of time and messages. Object diagrams show the structure of the objects receiving those messages. Together, they explain what happens and how the data is structured during that process.
State Machine Diagrams
State diagrams show the transitions of an object’s internal state. An object diagram can represent the object at a specific state, providing a snapshot of the attributes associated with that state.
Class Diagrams
This is the most common pairing. The Class Diagram defines the rules. The Object Diagram shows a valid instance of those rules. If the Object Diagram violates a constraint in the Class Diagram, the design is flawed.
Best Practices for Modeling 📝
To ensure your diagrams remain useful over time, adhere to these best practices.
- Consistent Naming: Use a standard naming convention for objects (e.g., prefix with lowercase, suffix with instance ID).
- Legend Usage: If you use custom symbols or colors, provide a legend to explain them.
- Version Control: Treat diagrams like code. Version them to track changes in the system architecture.
- Focus on Value: Only include objects and links that are relevant to the current discussion. Remove noise.
- Tool Selection: Use modeling tools that support UML standards to ensure compatibility and export options.
Real-World Application Scenarios 🌍
Let us look at how this applies in different contexts.
Scenario 1: E-Commerce Checkout
In an online store, a user adds items to a cart. An object diagram can show the Cart instance linked to multiple Item instances. It shows the price, quantity, and the Customer instance associated with the transaction. This helps verify that tax calculations are applied to the correct objects.
Scenario 2: Banking Transaction
When money moves between accounts, an object diagram captures the state before and after the transfer. It ensures that the Account instances reflect the new balances and that the Transaction instance records the correct timestamps and IDs.
Scenario 3: Social Network Connections
In a social platform, users connect with friends. An object diagram can visualize a specific user’s network. It shows the Profile object linked to multiple Post objects and Comment objects, helping to understand the depth of data retrieval required for a profile view.
The Value of Static Structure Visualization 💡
Why invest time in these diagrams? The benefits extend beyond simple documentation.
1. Enhanced Communication
Developers, testers, and product managers often speak different languages. Visualizing data relationships creates a common ground. Everyone sees the same connections between data points.
2. Reduced Bugs
Identifying incorrect object relationships early prevents runtime errors. If a diagram shows a link that should not exist, the code can be corrected before deployment.
3. Faster Onboarding
New team members can look at an object diagram to understand how the system is connected. It is often faster to read a diagram than to parse thousands of lines of code.
4. Database Optimization
Database administrators can use these diagrams to optimize queries. Knowing the exact relationships between instances helps in creating efficient indexes and joins.
Advanced Considerations for Large Systems 🏢
As systems scale, a single object diagram can become unwieldy. Here is how to manage complexity.
- Subsystems: Break the diagram into modules. One diagram per subsystem (e.g., “Payment Module Object Diagram”).
- Aggregation: Use high-level groupings for objects that are too numerous to display individually.
- Dynamic Links: Note that some links are transient. Indicate these in the diagram to avoid confusion about permanent storage.
- Automation: Where possible, generate diagrams from the codebase to ensure they stay up-to-date with the actual implementation.
Conclusion 🎯
Complex systems require clear communication. The UML Object Diagram offers a precise way to visualize the concrete state of a system. By distinguishing between the abstract class and the concrete instance, teams can align on data structure and relationships.
While not a replacement for class diagrams or code, it serves as a vital bridge between design and implementation. It helps answer the question: “What does the system actually look like right now?”. By following the steps, avoiding common mistakes, and integrating with other modeling techniques, you can simplify complex architectures and build more reliable software.
Start small. Model a single interaction. Expand as the system grows. Clarity is the goal, and object diagrams are a powerful tool to achieve it.