
Flowcharts remain one of the most powerful tools for clarifying complexity, enhancing communication, and driving process improvement. From their origins in industrial engineering to their current evolution with AI and Diagrams-as-Code, flowcharts have adapted to meet the needs of modern teams. This tutorial explores the triad of modern modeling: combining the visual clarity of Visual Paradigm, the precision of VPasCode, and the speed of AI generation.
The Evolution of Process Modeling
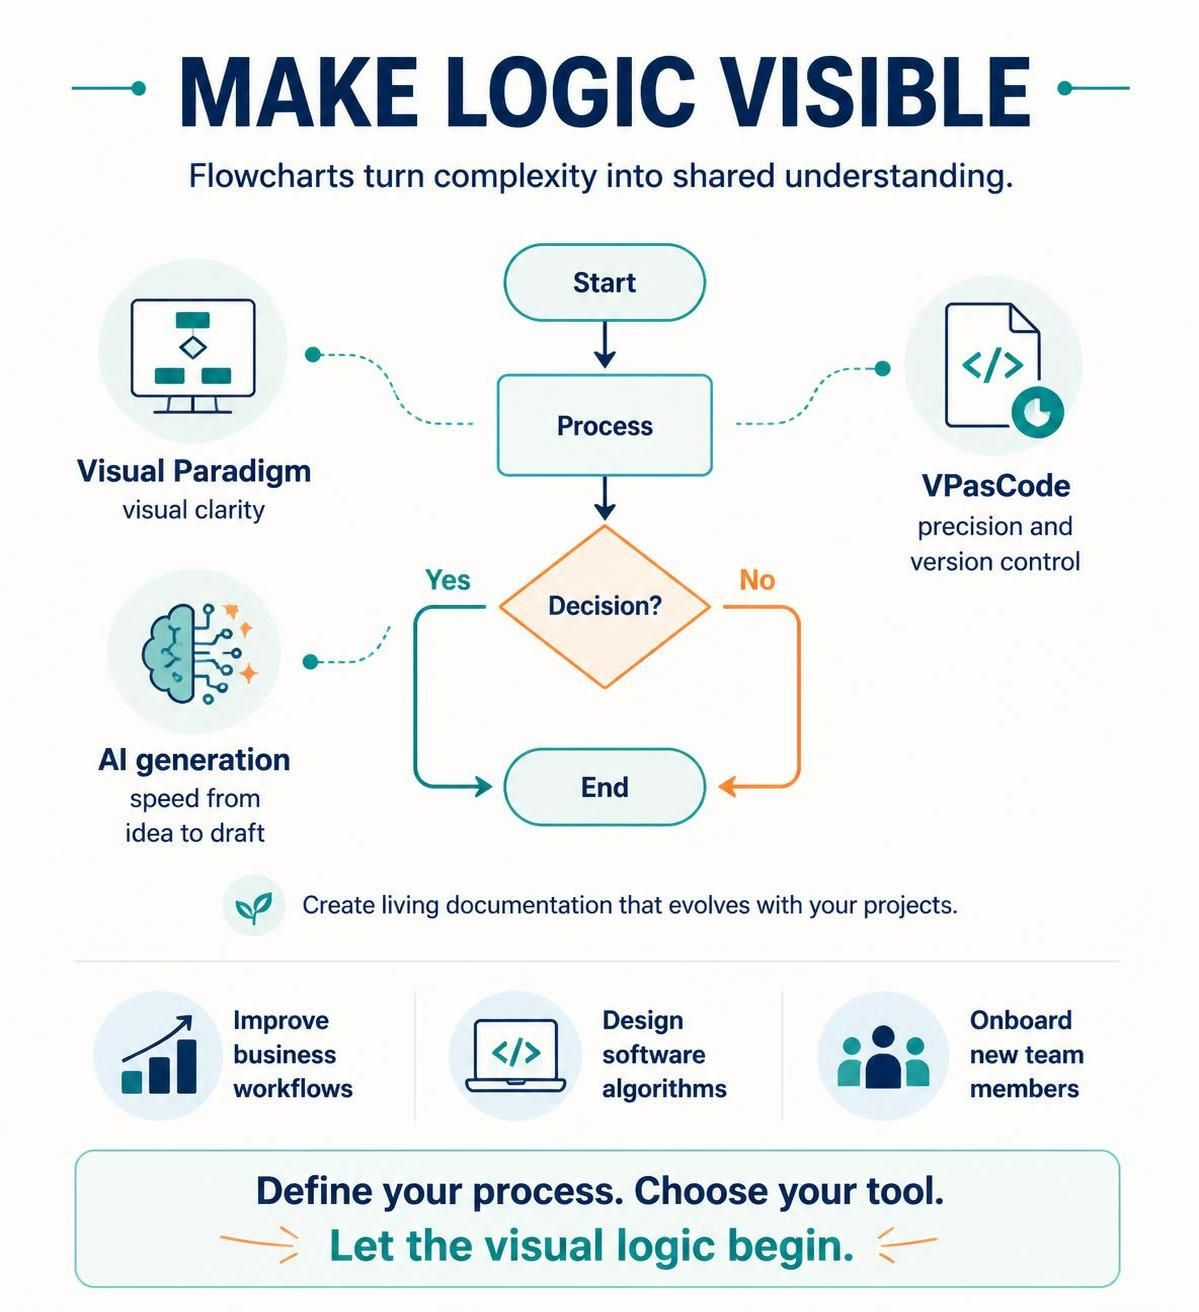
In the past, creating a process diagram was often a manual, time-consuming exercise. Today, we are witnessing a shift from static documents to “living assets”—diagrams that evolve alongside your projects. The infographic Make Logic Visible illustrates how three distinct capabilities converge to achieve this:
- Visual Paradigm (Visual Clarity): The traditional foundation. It provides the canvas for intuitive, drag-and-drop modeling that allows teams to understand complex logic at a glance.
- VPasCode (Precision & Version Control): The code-first approach. It allows developers and architects to define logic using text, ensuring 100% precision and enabling Git-based version control.
- AI Generation (Speed): The accelerator. It bridges the gap between a raw idea and a drafted diagram, drastically reducing the time spent on formatting.
Step-by-Step: Building the Core Logic
To understand how these tools interact, let’s deconstruct the standard flowchart logic depicted in the visual guide. A robust flowchart follows a specific lifecycle: Start → Process → Decision → Outcome.
1. The Start and Process Nodes
Every flow begins with a Start terminator, typically represented as an oval. This node initializes the flow. Following the start is the Process box (a rectangle), which represents an action or operation. In a software context, this might be a function call; in a business context, it might be a “Review Application” step.
2. The Decision Point
The most critical element in the diagram is the diamond shape, labeled Decision?. This represents a conditional branch where the logic splits based on a boolean outcome. Unlike a linear process, a decision node requires multiple outgoing paths, typically labeled “Yes” and “No” (or “True” and “False”).
3. The End State
Regardless of the path taken through the decision diamond, the logic must converge at an End terminator. This ensures the process is finite and has a clear resolution.
Implementing with VPasCode
While you can draw this visually, the VPasCode tool allows you to write the logic directly. This approach eliminates “pixel hunting” (struggling to align connectors) and makes the diagram a version-controlled artifact. Below is an example of how you would define the logic shown in the image using VPasCode syntax.
Start
  -> Process("Initiate Workflow")
  -> Decision("Check Conditions?")
    - Yes -> End("Process Complete")
    - No  -> End("Process Aborted")
In this snippet, the arrows (->) represent the flow direction. The labels in parentheses define the text inside the shapes. By maintaining this structure, you ensure that the visual representation remains perfectly synchronized with the textual definition.
Real-World Applications
The infographic highlights three specific domains where this “living documentation” approach yields the highest dividends:
- Optimizing Business Workflows: Use the Start and Process nodes to map out SOPs (Standard Operating Procedures). When a process changes, you update the VPasCode, and the diagram regenerates instantly.
- Designing Software Algorithms: The Decision node is the heart of algorithm design. Visual Paradigm allows you to visualize the logic tree, ensuring that every edge case (the “No” path) is accounted for before writing actual code.
- Onboarding New Team Members: A static image is often hard to read for newcomers. A “living” flowchart allows new hires to click through the logic, understanding the “Why” behind the “What.”
Conclusion
Whether you are optimizing a business workflow, designing a software algorithm, or onboarding new team members, mastering the art of the flowchart will pay dividends in clarity, efficiency, and collaboration. By combining the visual clarity of Visual Paradigm, the precision of VPasCode, and the speed of AI generation, you create a system where logic is not just drawn—it is built, tested, and evolved.
Ready to start? Define your process, choose your tool, and let the visual logic begin.