
In the realm of systems analysis and software architecture, clarity is currency. A well-crafted Data Flow Diagram (DFD) acts as the bridge between abstract requirements and concrete system implementation. Historically, creating these diagrams required switching between multiple tools—using Word for text and Visio for visuals—leading to fragmented knowledge and version control nightmares.
Enter OpenDocs by Visual Paradigm. This web-based platform revolutionizes the documentation process by centralizing knowledge and leveraging Artificial Intelligence to accelerate the modeling workflow. This tutorial explores the architecture of OpenDocs and guides you through the process of creating professional-grade DFDs using its AI-assisted features.
Understanding the OpenDocs Architecture
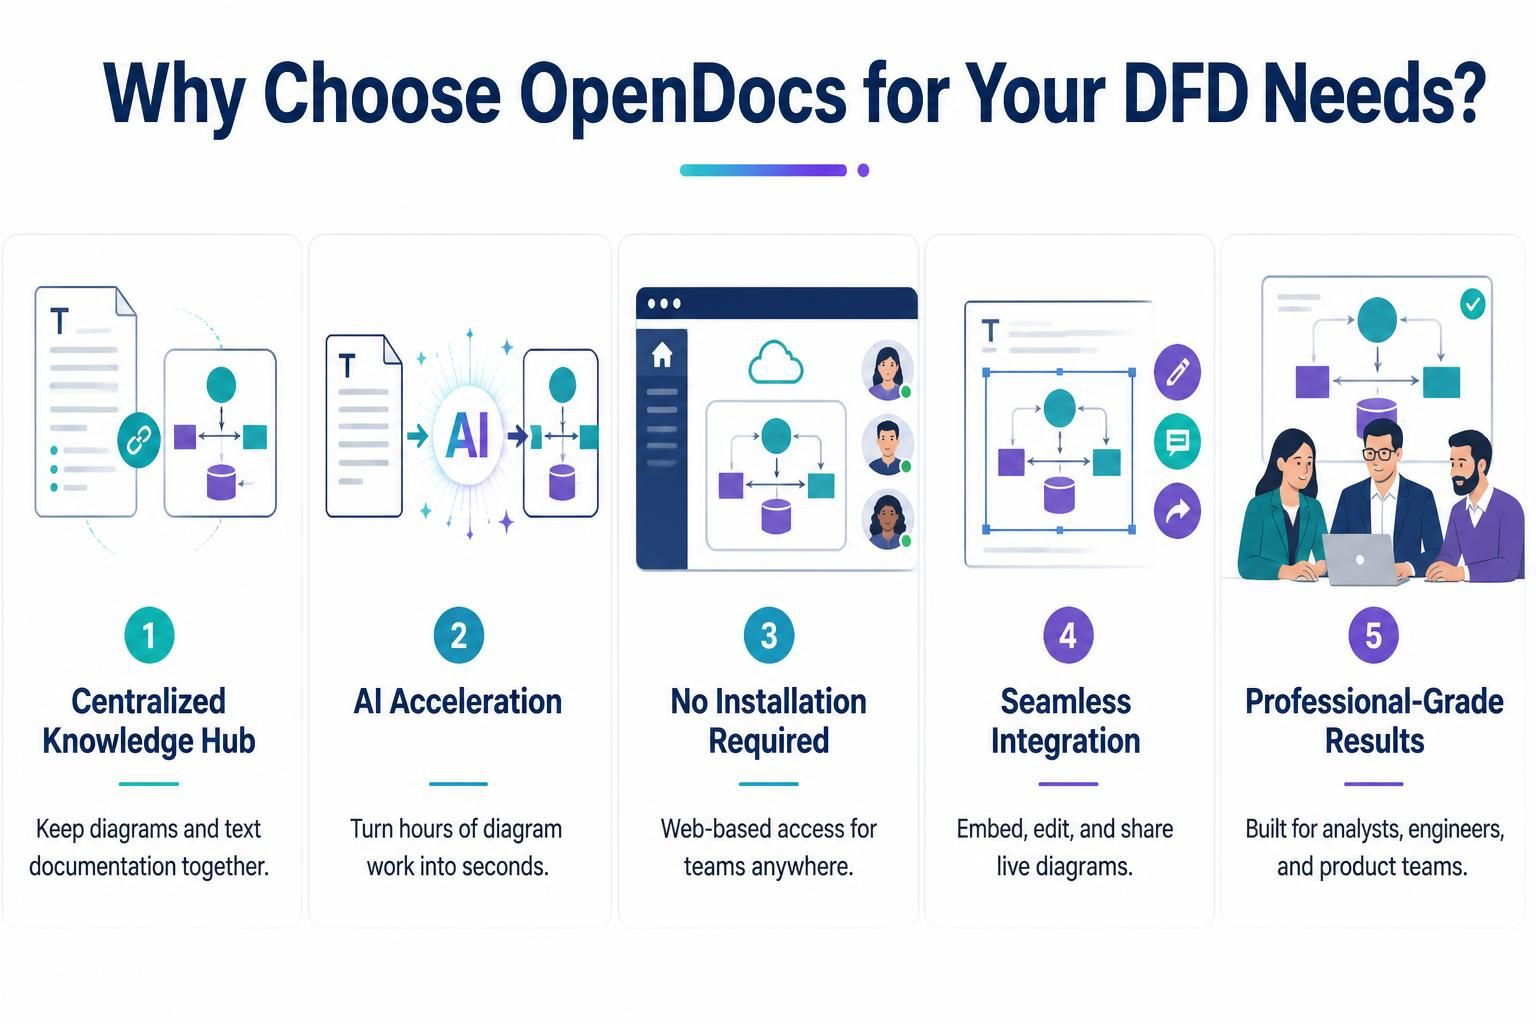
OpenDocs is designed as a cloud-native solution, distinct from traditional desktop modeling tools. Its architecture is built around five core pillars that address common pain points in technical documentation:
- Centralized Knowledge Hub: OpenDocs eliminates the “file silo” problem. Instead of separate text files and image files, the platform keeps your diagrammatic models and their accompanying documentation in a unified workspace. This ensures that a change in the logic is immediately reflected in the documentation.
- AI Acceleration: The system utilizes generative AI to interpret natural language descriptions and convert them into structured diagram elements. This reduces the time spent on manual drawing and layout, allowing engineers to focus on system logic rather than box placement.
- Cloud-Native Accessibility: As a fully web-based application, OpenDocs removes the overhead of software installation. This architecture supports remote teams, enabling real-time collaboration without the need for complex setup or licensing keys.
- Live Integration: Diagrams in OpenDocs are “live components.” They can be embedded directly into documentation pages or shared via links, ensuring that stakeholders always view the most current version of the system design.
- Industry Standards: The tooling is tailored to support the specific needs of analysts and engineers, ensuring that the resulting DFDs adhere to recognized standards like Gane & Sarson or Yourdon & Constantine.
Mastering the Data Flow Diagram (DFD)
Before diving into the tool, it is essential to understand the concepts you are modeling. A Data Flow Diagram is a graphical representation of the “flow” of data through an information system. Unlike a flowchart, which shows control flow (logic), a DFD shows data flow.
A robust DFD typically consists of four fundamental components:
- External Entities: Represented by rectangles (or circles in some notations), these are the sources or destinations of data outside the system boundary (e.g., a Customer, a Bank, or a Third-Party API).
- Processes: Represented by circles or rounded rectangles, these transform incoming data into outgoing data. They are the “verbs” of your system (e.g., “Calculate Tax” or “Validate User”).
- Data Stores: Represented by open-ended rectangles or cylinders, these represent where data is stored for later use (e.g., a Database, a File, or a Spreadsheet).
- Data Flows: Represented by arrows, these show the movement of data between entities, processes, and stores. Every arrow must be labeled with the specific data being transferred.
Step-by-Step: Creating a DFD with OpenDocs
Using OpenDocs to create a Level 0 (Context) or Level 1 DFD is significantly faster than traditional methods due to its AI capabilities. Here is how to build your system model:
1. Define Your Scope
Start by identifying the system boundary. In OpenDocs, you can describe your system in natural language. For example, you might enter a prompt like: “Create a Level 0 DFD for an E-commerce Order Processing System.”
2. Leverage AI Generation
Once the prompt is submitted, the AI engine analyzes the requirements and generates the structural components of the diagram. It automatically places the central process, external entities (like ‘Customer’ and ‘Warehouse’), and data stores (like ‘OrderDB’).
The AI handles the layout and initial connections, allowing you to focus on the logic and naming conventions.
3. Refine and Edit
While the AI provides a strong foundation, your expertise is needed for refinement. OpenDocs provides a seamless interface to:
- Drag and drop new entities if the AI missed a data source.
- Label data flows with precision (e.g., changing “Data” to “Shipping Address”).
- Connect processes to data stores to represent persistence.
4. Collaborate and Integrate
Once the diagram is complete, you can utilize the “Seamless Integration” feature. Embed the diagram directly into your project wiki, share a live link with your team for real-time comments, or export it as a high-resolution vector image.
Why OpenDocs is the Modern Choice
The shift from static diagramming to AI-assisted modeling represents a significant evolution in systems engineering. By combining the analytical rigor of DFDs with the speed of AI generation, OpenDocs empowers teams to visualize complex data flows with unprecedented efficiency.
Whether you are a business analyst mapping out a new customer journey or a software architect designing a microservices ecosystem, OpenDocs provides the clarity and efficiency you need to succeed. The platform’s ability to keep diagrams and text documentation together ensures that your system design remains a single source of truth.
Ready to transform how you document data flows? OpenDocs is accessible anywhere, requiring no installation. Start creating your first AI-generated Data Flow Diagram today and experience the future of system modeling.