
In the complex landscape of software development and organizational design, a single tool often needs to bridge the gap between abstract business requirements and concrete technical implementation. Visual Paradigm Desktop serves as this critical bridge, offering a unified environment for diverse roles ranging from software engineers to enterprise architects. This tutorial explores the core concepts of system architecture and modeling, demonstrating how these distinct professional workflows converge to build robust, scalable solutions.
The Architecture of Modern Development
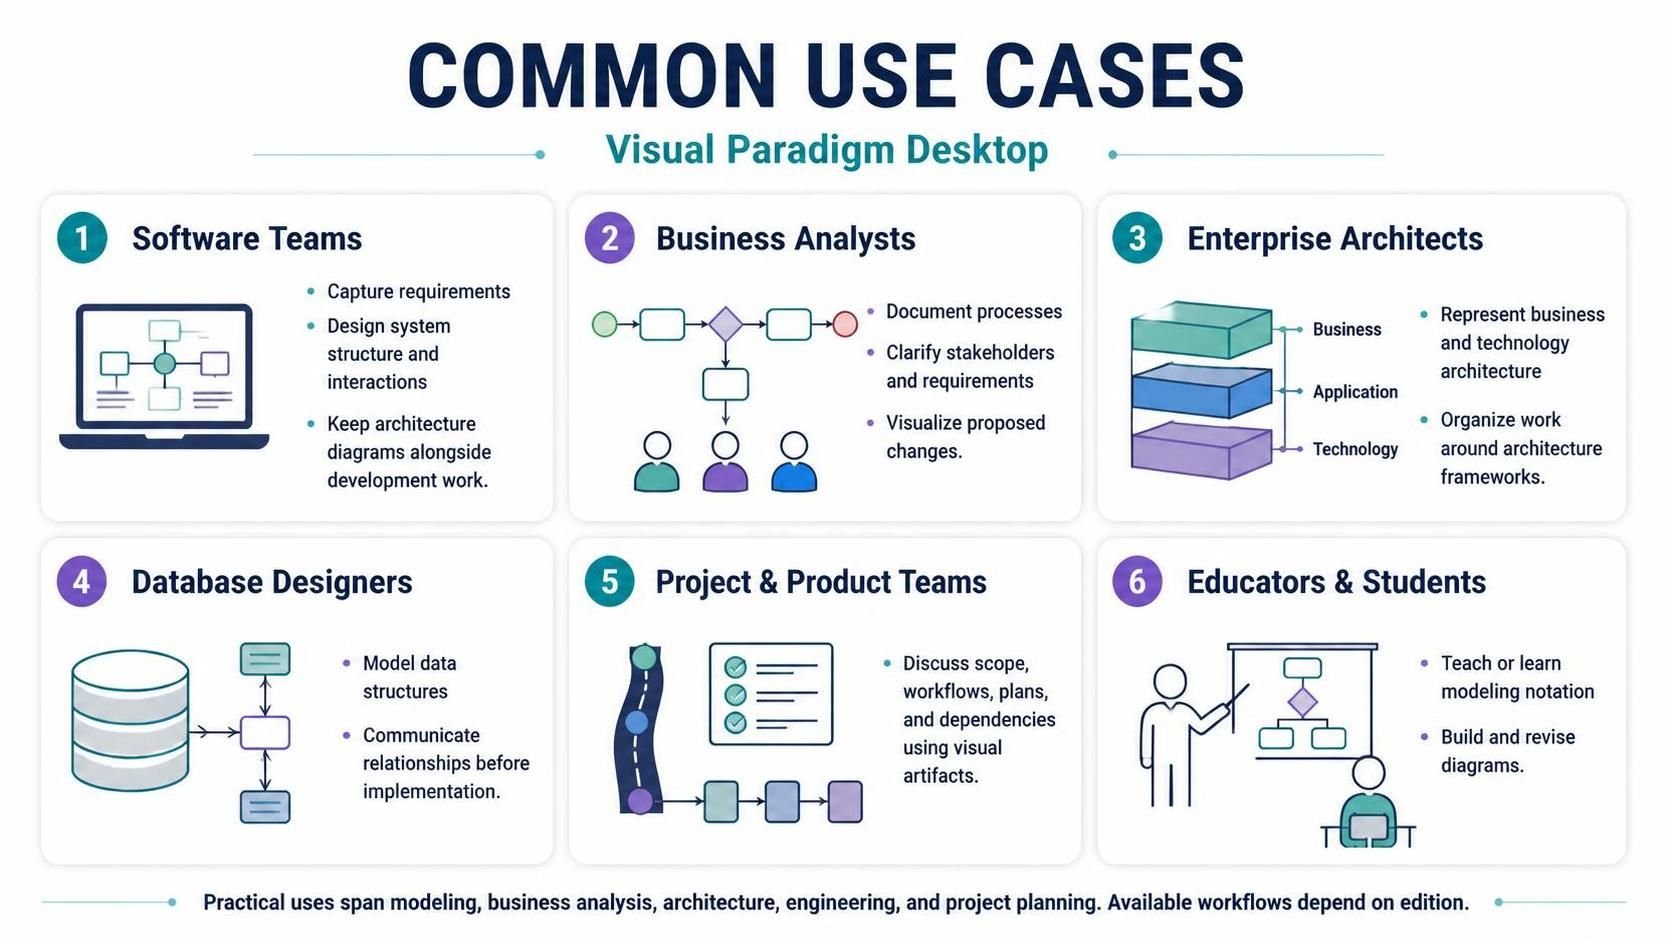
System architecture is not merely about drawing boxes and lines; it is about defining the structure of a system, its components, and the relationships between them. The image provided highlights six distinct workflows, each representing a specific layer of the software development lifecycle (SDLC). Understanding how these layers interact is essential for creating a cohesive system.
1. The Foundation: Software Teams and System Structure
At the heart of any technical project lies the Software Team. Their primary responsibility is to translate vague requirements into a solid system structure. In Visual Paradigm, this is achieved through rigorous modeling.
- Capture Requirements: Before writing a single line of code, teams must define what the system must do. Usecases and user stories are often mapped here.
- Design System Structure: This involves defining the classes, modules, and their interactions. A Class Diagram is the standard artifact for this purpose, showing attributes, methods, and associations.
- Keep Diagrams Live: A key feature of modern tools is “round-trip engineering.” This means the architecture diagrams are not static images but are linked to the actual codebase. If the code changes, the diagram updates, and vice versa.
2. The Process: Business Analysts and Flow Logic
Business Analysts act as the translators between stakeholders and developers. They focus on the “how” and “when” of operations. The image depicts a flowchart, which is central to this role.
- Document Processes: Using Activity Diagrams or Flowcharts, analysts map out the sequence of operations. This includes decision points (diamonds) and process steps (rectangles).
- Clarify Stakeholders: By visualizing the process flow, ambiguity is reduced. Everyone sees the same path, ensuring that requirements are met.
- Visualize Changes: When a business rule changes, the diagram is updated first. This allows the team to simulate the impact of the change before it is implemented in the system.
3. The Big Picture: Enterprise Architects and Frameworks
While developers look at the code, Enterprise Architects look at the ecosystem. The image shows a layered approach (Business, Application, Technology), which is the standard for TOGAF (The Open Group Architecture Framework).
- Business Architecture: Defines the strategy, governance, and business processes.
- Application Architecture: Describes the interaction of systems, services, and applications.
- Technology Architecture: Details the hardware, software, and network infrastructure.
Visual Paradigm allows architects to organize these layers, ensuring that the technical implementation (bottom layer) actually supports the business goals (top layer).
4. The Data: Database Designers and Entity Modeling
Data is the lifeblood of any application. Database Designers use the Entity-Relationship Diagram (ERD) to model the data structures. As shown in the image, this involves connecting database cylinders (tables) with lines representing relationships (one-to-many, many-to-many).
This step is crucial because it happens before implementation. By modeling the relationships first, designers prevent data redundancy and integrity issues that are costly to fix later.
5. The Execution: Project and Product Teams
Once the architecture is defined, Project and Product Teams must manage the execution. They use visual artifacts to discuss scope, workflows, plans, and dependencies. This often involves Gantt charts, Kanban boards, or sequence diagrams to visualize the timeline and the interaction of components over time.
6. The Future: Educators and Students
Finally, the Educational aspect cannot be overstated. Modeling notation is a language. By building and revising diagrams, students and educators learn the syntax of system design. Visual Paradigm acts as a sandbox for this learning, allowing users to test their understanding of concepts like inheritance, polymorphism, and concurrency.
Conclusion
The workflows shown in the image represent a holistic approach to engineering. No single role works in isolation. The Enterprise Architect ensures the business goal is met, the Business Analyst defines the process, the Database Designer secures the data, and the Software Team builds the structure. Visual Paradigm Desktop unifies these workflows into a single, cohesive platform, ensuring that everyone is working from the same source of truth.