
In the rapidly evolving landscape of software architecture, maintaining documentation that keeps pace with code has become a critical challenge. This tutorial explores VPasCode, Visual Paradigm’s revolutionary approach to system modeling. By leveraging the Diagram-as-Code methodology, VPasCode shifts the paradigm from visual manipulation to declarative text editing. This guide will walk you through the core architecture, the strategic selection of diagramming engines, and how to leverage the C4 model for scalable system design.
1. The Philosophy of Diagram-as-Code
Traditionally, architects spent hours dragging and dropping boxes, manually aligning connectors, and wrestling with visual layouts. VPasCode eliminates this friction. At its heart, the system embraces the Diagram-as-Code methodology, treating diagram definitions as plain text files. This approach delivers three foundational advantages that are essential for modern DevOps and engineering teams:
- Version Control: Diagram definitions are stored as plain text, enabling seamless Git integration. This allows teams to utilize standard code review workflows, track changes via diffs, and maintain a clear history of architectural evolution.
- Consistency & Standardization: The built-in rendering engine automatically handles layout, alignment, spacing, and visual styling. This ensures uniform output regardless of diagram complexity, removing the “artistic” variance that often plagues manual diagramming tools.
- Speed & Maintainability: Structural updates require only text edits rather than manual repositioning or rewiring. This significantly reduces maintenance overhead and minimizes human error when refactoring complex systems.
2. Multi-Engine Architecture Support
VPasCode functions as a unified hub that natively supports three industry-standard diagramming markup languages. Each engine is optimized for specific modeling needs, allowing architects to choose the right tool for the specific architectural layer being documented.
| Engine | Core Visual Strength | Common Use Cases |
|---|---|---|
| PlantUML | Rigid engineering standards & system boundaries | C4 Architecture models, strict UML Class/Sequence/Deployment diagrams, component mapping |
| Mermaid | Markdown integration & rapid documentation | Flowcharts, simplified sequence diagrams, state machines, timelines, Gantt charts |
| Graphviz | Relational logic & structural networks | Directed graphs (DOT), hierarchical mappings, dependency trees, mathematical networks |
3. Deep Dive: Implementing C4 Architecture with PlantUML
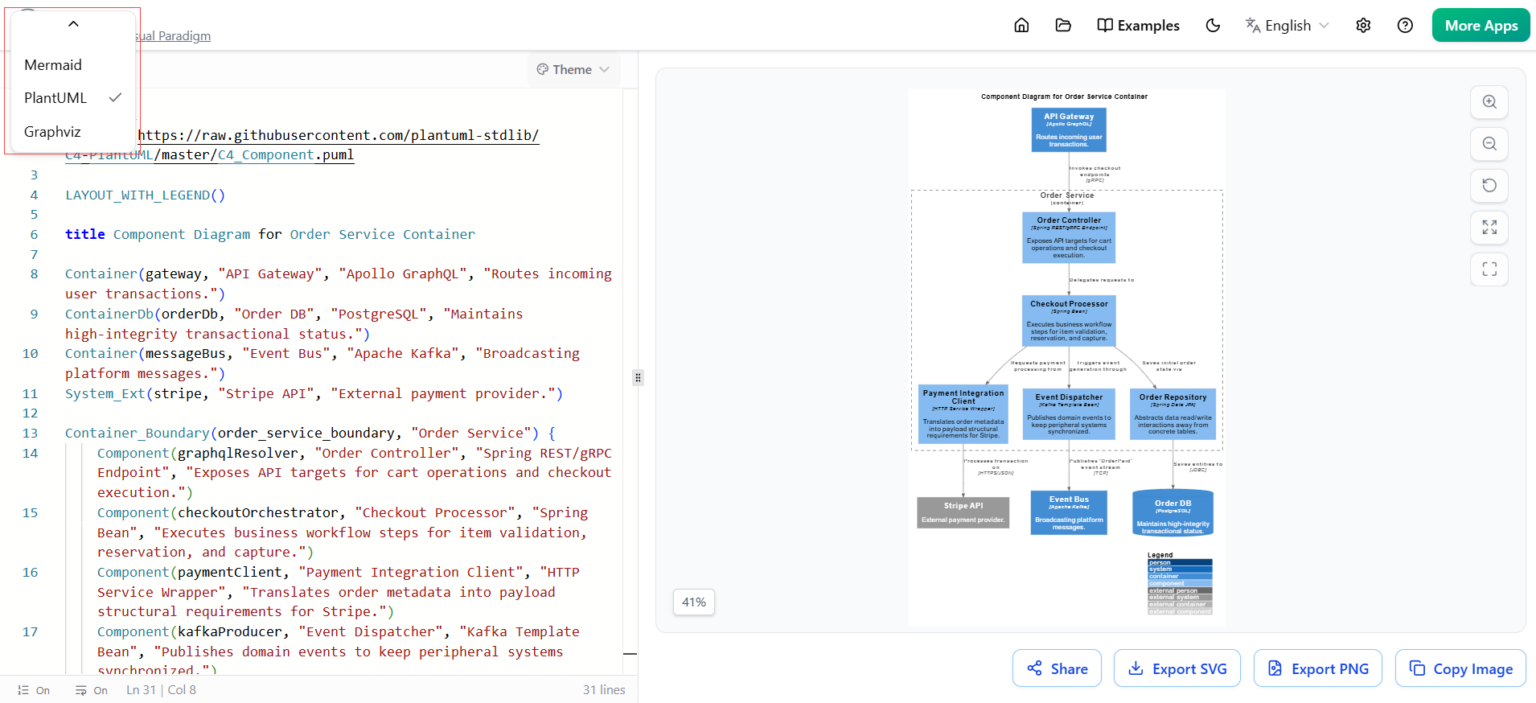
The screenshot provided in the context highlights the power of PlantUML within VPasCode. The C4 model (Context, Container, Component, Code) is a hierarchical approach to software architecture documentation. Let’s break down the syntax used in the “Order Service Container” example to understand how it translates text into a structured diagram.
Step 1: Defining the Scope
First, we define the layout and the title of our diagram. The LAYOUTWITHLEGEND() directive ensures that the diagram renders with a clear legend for easy interpretation.
LAYOUT_WITH_LEGEND()

title Component Diagram for Order Service Container
Step 2: Defining System Boundaries (Containers)
The core of C4 modeling is defining “Containers”—distinct deployable units like web applications, mobile apps, or databases. In the example, we define the API Gateway, the Database, and the Message Bus using the Container keyword.
Container(gateway, "API Gateway", "Apollo GraphQL", "Routes incoming user transactions.")
ContainerDb(orderDb, "Order DB", "PostgreSQL", "Maintains high-integrity transactional status.")
Container(messageBus, "Event Bus", "Apache Kafka", "Broadcasting platform messages.")
System_Ext(stripe, "Stripe API", "External payment provider.")
Step 3: Grouping Components
Inside a Container, we define “Components”—logical groupings of functionality. The example uses Container_Boundary to define the “Order Service” container. Inside this boundary, we define specific components like the Order Controller and Checkout Processor.
Container_Boundary(order_service_boundary, "Order Service") {
    Component(graphqlResolver, "Order Controller", "Spring REST/gRPC Endpoint", "Exposes API targets for cart operations and checkout execution.")
    Component(checkoutOrchestrator, "Checkout Processor", "Spring Bean", "Executes business workflow steps for item validation, reservation, and capture.")
    Component(paymentClient, "Payment Integration Client", "HTTP Service Wrapper", "Translates order metadata into payload structural requirements for Stripe.")
    Component(kafkaProducer, "Event Dispatcher", "Kafka Template Bean", "Publishes domain events to keep peripheral systems synchronized.")
}
4. Analyzing the Rendered Output
When VPasCode processes this code, it generates a highly structured diagram that maps out the flow of data:
- API Gateway: Acts as the entry point, routing transactions.
- Order Service: Contains the logic for handling requests, including the Order Controller and Checkout Processor.
- External Systems: The diagram clearly delineates the interaction with the Stripe API for payments and the Event Bus for asynchronous communication.
- Data Persistence: The Order DB is shown maintaining the high-integrity status of transactions.
This visual representation is not just a static image; it is a dynamic artifact that reflects the code structure. If you modify the code to add a new component, the diagram updates automatically.
Conclusion
By utilizing VPasCode, engineering teams can adopt a rigorous yet flexible approach to documentation. Whether you are building a complex C4 model with PlantUML, a quick flowchart with Mermaid, or a dependency graph with Graphviz, the “Diagram-as-Code” methodology ensures that your architecture documentation is as maintainable and version-controlled as your actual source code.