
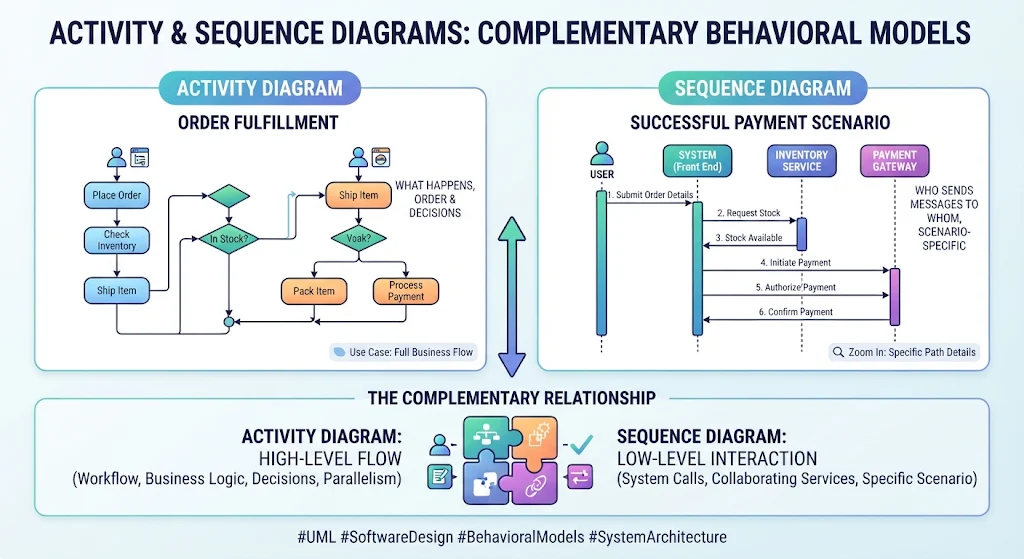
In the realm of software architecture and system design, clarity is paramount. Two of the most powerful tools in the Unified Modeling Language (UML) arsenal for describing system behavior are the Activity Diagram and the Sequence Diagram. While they both describe how a system behaves, they offer distinct perspectives that, when combined, provide a complete understanding of complex business logic.
This tutorial explores how to leverage these two diagrams together to model an “Order Fulfillment” system. We will examine how to define the high-level business workflow and then zoom in on the specific technical interactions required to execute that workflow, utilizing the capabilities of the Visual Paradigm (VPasCode) tool.
1. The High-Level View: Activity Diagrams
An Activity Diagram is essentially a flowchart for your application. It is the “bird’s-eye view” that captures the control flow and data flow of a system. It answers the question: “What happens, in what order, and where are the decision points?”
In our Order Fulfillment scenario, the Activity Diagram maps out the entire lifecycle of an order, from the moment a user initiates the process to the final shipping confirmation. It handles complex logic such as:
- Sequential Steps: The standard path where the user places an order, the system checks inventory, and items are shipped.
- Decision Nodes (Diamonds): Critical branching points, such as “Is the item in stock?” If yes, the process moves to packing; if no, it triggers a different workflow.
- Parallelism: The ability to split a process into concurrent threads (e.g., processing payment while simultaneously packing the item), represented by fork and join bars.
By visualizing these steps, stakeholders can immediately grasp the business logic without getting bogged down in code-level implementation details.
2. The Low-Level View: Sequence Diagrams
Once the high-level flow is established, we must define how the system components collaborate to achieve the steps defined in the activity diagram. This is where the Sequence Diagram comes in. It focuses on the interactions between objects over time.
For the “Successful Payment Scenario,” the Sequence Diagram details the message exchange between:
- Actor (User): The initiator of the request.
- System (Front End): The interface handling the user’s input.
- Inventory Service: A backend service verifying stock availability.
- Payment Gateway: An external service handling financial transactions.
The diagram maps the chronological order of method calls and API requests. It ensures that the logic defined in the activity diagram is technically feasible and that all dependencies (like checking stock before charging a card) are strictly ordered.
3. The Complementary Relationship
The true power of system modeling lies in the synergy between these two diagrams. They are not mutually exclusive; they are complementary layers of abstraction.
The Activity Diagram defines the Scope and Logic (The “What”), while the Sequence Diagram defines the Architecture and Implementation (The “How”).
When using tools like Visual Paradigm, you can often link these diagrams. A specific node in an Activity Diagram (e.g., the “Process Payment” step) can be linked to a Sequence Diagram that details the exact API calls made during that step. This creates a traceable path from business requirement to technical specification.
4. Modeling with VPasCode
Visual Paradigm’s VPasCode feature allows developers to generate these diagrams using text-based descriptions or code generation. This accelerates the modeling process by allowing you to define the structure of your system without manually dragging and dropping shapes.
For example, when defining the Activity Diagram in VPasCode, you would typically structure the logic to reflect the flowchart nodes:
@startuml
title Order Fulfillment Activity Diagram

start
:Place Order;
:Check Inventory;
if (In Stock?) then (yes)
  :Ship Item;
  :Pack Item;
else (no)
  :Process Payment;
  :Pack Item;
endif
stop
@enduml
Conversely, the Sequence Diagram in VPasCode focuses on defining the participants (lifelines) and the temporal flow of messages:
@startuml
title Successful Payment Scenario

participant User
participant System as "System (Front End)"
participant Inventory as "Inventory Service"
participant Payment as "Payment Gateway"

User -> System: 1. Submit Order Details
System -> Inventory: 2. Request Stock
Inventory --> System: 3. Stock Available
System -> Payment: 4. Initiate Payment
Payment --> System: 5. Authorize Payment
System --> User: 6. Confirm Payment
@enduml
Conclusion
Mastering the interplay between Activity and Sequence diagrams is essential for robust system architecture. The Activity Diagram ensures your business logic is sound and comprehensive, while the Sequence Diagram validates that your technical components can communicate effectively to execute that logic. By utilizing modern tooling like VPasCode, you can maintain a rigorous, code-to-diagram traceability that keeps your development team aligned from concept to deployment.