
In the landscape of modern knowledge management, the ability to convey complex quantitative data alongside qualitative strategy is paramount. This tutorial explores the architecture of embedding dynamic data visualizations—specifically pie charts and trend analysis—directly within technical notes. We will examine how systems like VPasCode and NotesKeep integrate these visual layers to create a unified “AI knowledge base” where unstructured notes and structured data models coexist.
1. The Architecture of Embedded Visualization
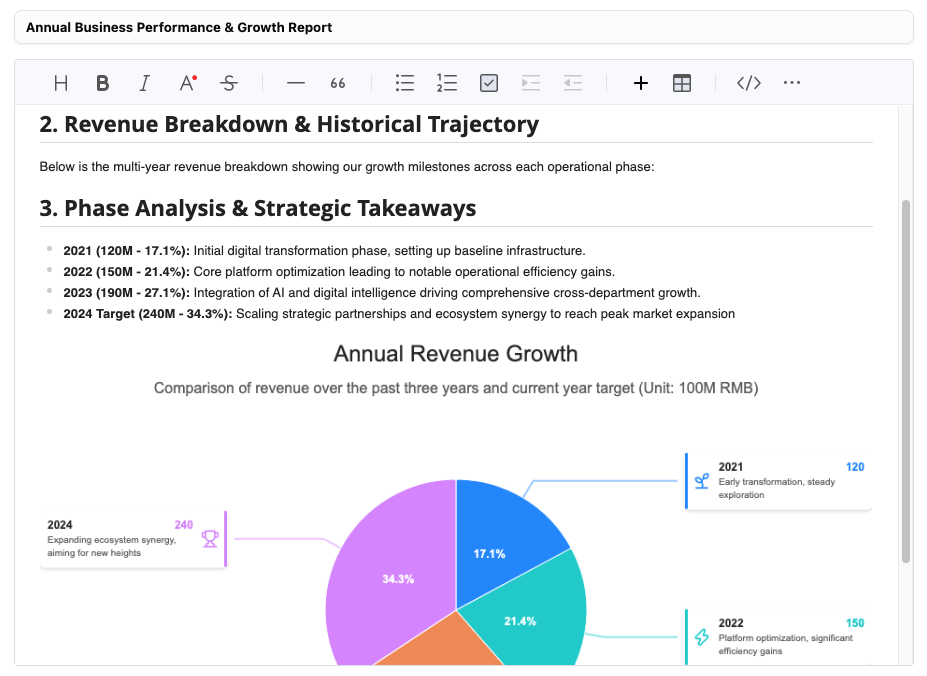
The screenshot provided demonstrates a sophisticated document layout where an Annual Business Performance & Growth Report is presented. The visual element is not merely an image pasted into a text field; it is an interactive component that bridges the gap between static text and dynamic data.
The diagram serves a dual purpose:
- Data Aggregation: It aggregates multi-year revenue data (2021–2024) into a single visual snapshot.
- Strategic Annotation: It links specific data points to narrative context, explaining why the numbers shifted.
Deconstructing the Visual Elements
Let’s analyze the specific components of this infographic to understand how they function as a communication tool:
- The Central Pie Chart: This represents the proportional contribution of each phase to the total volume. The slices are color-coded (Blue, Teal, Orange, Purple) to distinguish distinct operational eras.
- The Callout Lines: These are critical for context. Instead of a legend (which forces the reader to look away), the lines connect the slice directly to its metadata.
- The Metadata Cards: Each label contains a year, a revenue figure (in 100M RMB), and a qualitative summary of the phase’s goal (e.g., “Initial digital transformation”).
2. Concept: The “Data-Text Fusion” Model
Traditional documentation often separates the “story” (text) from the “proof” (charts). The architecture shown here utilizes a Data-Text Fusion model. This approach ensures that the strategic takeaways are immediately legible without requiring the reader to cross-reference a separate Excel sheet or a different document tab.
The Logic Flow:
- Input: Raw data points (e.g., Revenue: 120M, 150M, 190M).
- Processing: The system calculates the percentage share of the total sum for the pie chart.
- Annotation: The system pulls associated “Phase Descriptions” from the text body (or a linked database) to populate the callout boxes.
- Output: A composite graphic where the visual weight of the data is balanced by the explanatory text.
3. Implementation Logic: Modeling the Visualization
To replicate this functionality in a structured environment like VPasCode or a Mermaid.js diagram, we must define the relationships between the data points and the narrative labels. The following pseudo-code demonstrates how to structure the logic for generating this specific report type.
Step 1: Define the Data Model
First, we establish the core entities: the Fiscal Year, the Revenue Value, and the Strategic Theme.
// Data Structure for Annual Growth Report
const fiscalData = [
  {
    year: "2021",
    value: 120,
    unit: "100M RMB",
    percent: "17.1%",
    phase: "Initial Digital Transformation",
    description: "Setting up baseline infrastructure."
  },
  {
    year: "2022",
    value: 150,
    unit: "100M RMB",
    percent: "21.4%",
    phase: "Core Platform Optimization",
    description: "Driving operational efficiency gains."
  },
  {
    year: "2023",
    value: 190,
    unit: "100M RMB",
    percent: "27.1%",
    phase: "AI Integration",
    description: "Driving cross-department growth."
  },
  {
    year: "2024",
    value: 240,
    unit: "100M RMB",
    percent: "34.3%",
    phase: "Strategic Scaling",
    description: "Targeting peak market expansion."
  }
];
Step 2: The Rendering Logic
The system iterates through the data to generate the visual segments. In a coding context, this often involves calculating the angle of each slice based on the percentage value.
// Pseudo-code for Pie Chart Generation
function generatePieChart(data) {
  let totalRevenue = data.reduce((acc, curr) => acc + curr.value, 0);

  data.forEach(entry => {
    // Calculate percentage
    entry.percent = (entry.value / totalRevenue * 100).toFixed(1) + "%";

    // Assign color based on growth phase
    let color = getColor(entry.phase);

    // Render slice and attach metadata
    renderSlice(entry.percent, color, {
      label: entry.year,
      tooltip: entry.description
    });
  });
}
4. Strategic Takeaways from the Diagram
The visual representation allows stakeholders to instantly recognize the trajectory of the business. The shift from the blue slice (2021) to the purple slice (2024) visually communicates the acceleration of growth.
- 2021 (17.1%): The smallest slice represents the “Initial digital transformation phase.” This is the baseline.
- 2022 (21.4%): A slight increase representing “Core platform optimization.”
- 2023 (27.1%): A significant jump, indicating “Integration of AI.”
- 2024 (34.3%): The largest slice, showing “Scaling strategic partnerships.”
This visual hierarchy proves that the company is not just growing linearly; it is growing exponentially as it moves through strategic phases.
5. Conclusion: From Static to Dynamic
By integrating these visual modeling concepts into NotesKeep and similar platforms, teams move beyond simple text logs. They create a living documentation system where the “System Architecture” includes not just code and logic, but also the business logic driving the product.
This approach reduces the cognitive load on the reader. Instead of mentally converting “120M” into a visual magnitude, the brain processes the pie slice size immediately, allowing for faster strategic decision-making.