In the landscape of software architecture and system design, visual representations serve as the bridge between abstract logic and concrete implementation. Among the various Unified Modeling Language (UML) notations available, the object diagram stands out for its ability to depict a snapshot of a system at a specific moment in time. Unlike class diagrams, which define the blueprint, object diagrams illustrate the actual data and connections existing within a running environment. This guide explores the technical nuances of constructing precise object diagrams for technical documentation.
🧠 Understanding the Object Diagram
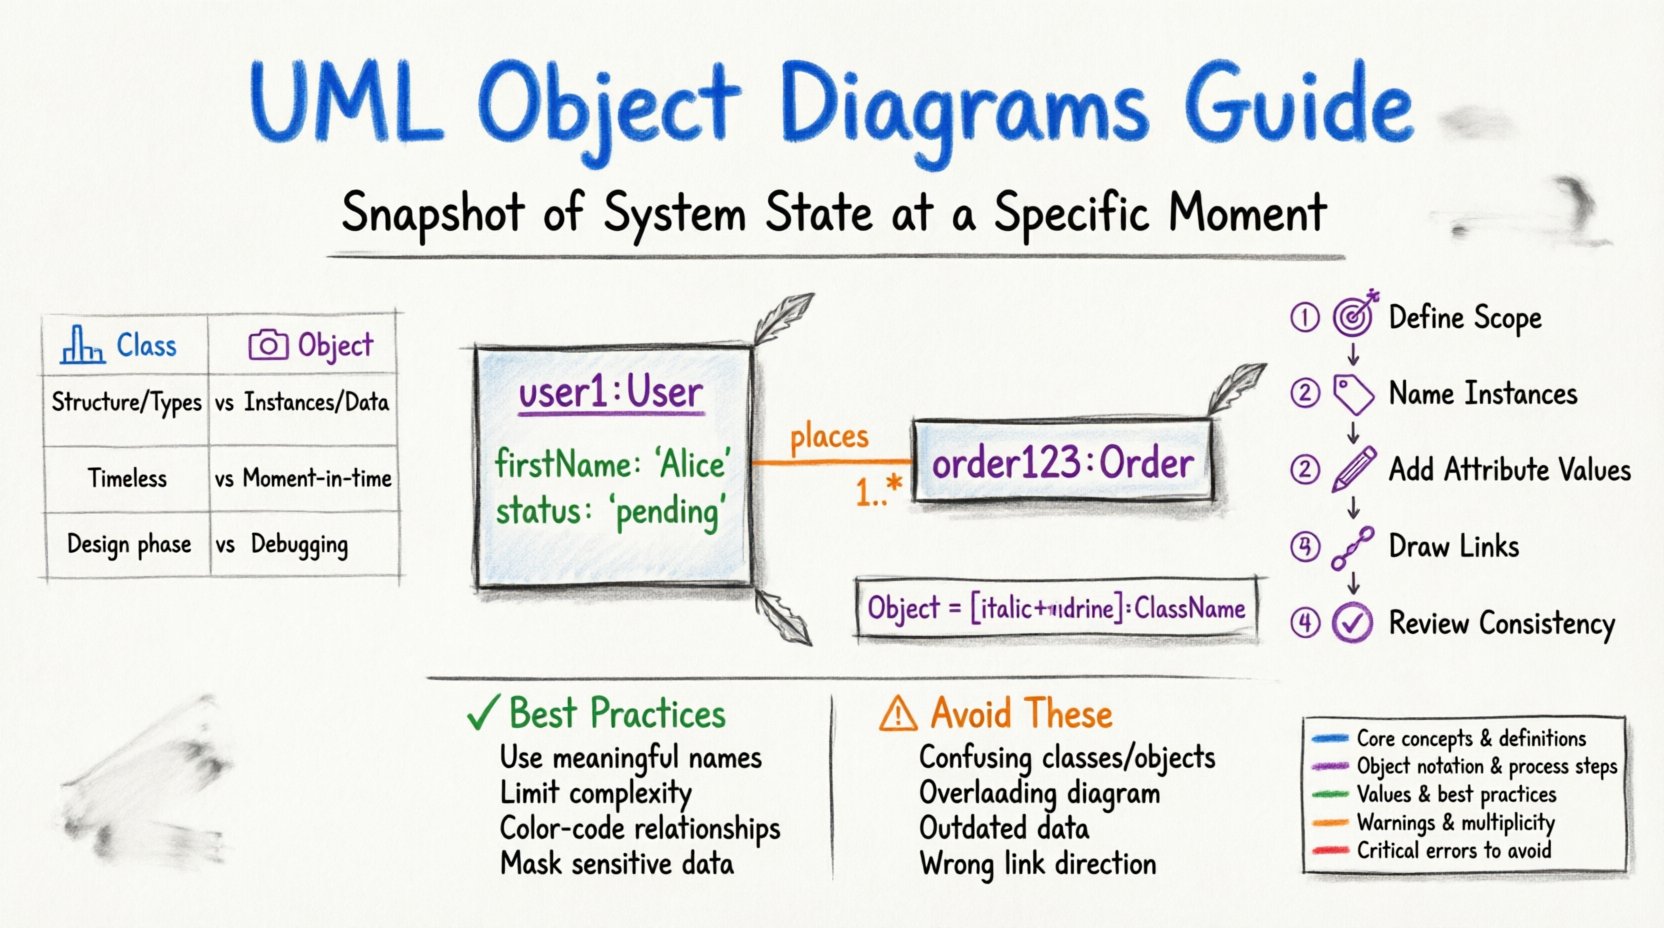
An object diagram is a static structure diagram that describes the structure of a system by showing its objects instead of classes. It provides a snapshot of detailed instances at a specific time. While class diagrams define the types of objects and the relationships between them, object diagrams focus on the instances themselves. This distinction is critical for documentation purposes because it allows stakeholders to visualize actual data states rather than theoretical possibilities.
When creating documentation, clarity is paramount. An object diagram reduces ambiguity by showing specific values assigned to attributes and concrete links between instances. This specificity is particularly useful during debugging phases, code reviews, or when explaining complex data flows to non-technical stakeholders.
🔍 Core Components and Notation
To build an accurate diagram, one must adhere to standard notation rules. Deviating from these standards can lead to misinterpretation. The following elements form the backbone of any object diagram:
- Objects: Represented as rectangles. The object name is written in italics and underlined, followed by the class name separated by a colon. For example, user1:User.
- Attributes: Listed inside the object rectangle. Each attribute shows the name, an equals sign, and the specific value for that instance. For example, firstName: “Alice”.
- Links: Represented as lines connecting objects. These are the instances of associations found in class diagrams. They show how specific objects relate to one another.
- Multiplicity: Defined at the ends of links. This indicates how many instances of one object can be associated with another instance.
Visual consistency ensures that the documentation remains readable over time. All objects should be aligned logically, and link labels should be placed clearly to avoid crossing other lines unnecessarily.
⚖️ Distinguishing Class Diagrams from Object Diagrams
Confusion often arises between class diagrams and object diagrams. Understanding the difference prevents documentation errors. The table below outlines the key distinctions.
| Feature | Class Diagram | Object Diagram |
|---|---|---|
| Focus | Structure and types | Instances and data |
| Timeframe | General, timeless | Specific moment in time |
| Content | Class names, methods, attributes | Object names, instance values, links |
| Usage | Design phase, high-level architecture | Debugging, data snapshots, detailed specs |
| Notation | Class name in bold | Instance name italicized and underlined |
Using the correct diagram type for the specific documentation need ensures that the audience receives the intended level of detail. A class diagram is better for showing system capabilities, while an object diagram excels at showing current state.
🛠️ Step-by-Step Creation Process
Constructing a reliable diagram requires a methodical approach. Rushing the process often results in incomplete relationships or missing data points. Follow this structured workflow to ensure accuracy.
1. Define the Scope and Context
Before drawing any shapes, determine what the diagram will represent. Are you documenting a specific transaction flow? A user session state? A database dump? Defining the scope prevents the diagram from becoming cluttered with irrelevant instances.
- Identify the specific scenario being modeled.
- Decide which classes are relevant to this scenario.
- Exclude classes that do not participate in the current snapshot.
2. Identify and Name Instances
Once the scope is clear, list the specific instances that exist in this state. Naming conventions are vital here. Use unique identifiers for objects to avoid confusion. For example, instead of generic labels like “Object1” or “User2”, use meaningful identifiers like customerOrder459 or paymentGatewayActive.
- Ensure the object name is italicized and underlined.
- Separate the name from the class name with a colon.
- Verify that the object name matches the naming conventions used in the codebase.
3. Populate Attributes with Values
Unlike class diagrams where attributes define properties, object diagrams define the current values of those properties. This step adds the “truth” to the diagram.
- List all attributes defined in the class.
- Assign the actual data value for this instance.
- Format values clearly (e.g., strings in quotes, numbers as digits).
- Hide attributes that are null or not applicable to keep the diagram clean.
4. Draw Links and Relationships
Links connect the objects. These represent the actual relationships existing at this moment. You must ensure that the links match the association definitions in the class diagram.
- Draw a straight or orthogonal line between connected objects.
- Label the link if it carries a specific role name.
- Indicate the direction of the relationship if it is navigable.
- Verify multiplicity constraints are respected (e.g., a single order cannot link to zero items if the schema requires it).
5. Review for Consistency
After drawing, perform a consistency check. Does the diagram reflect the current state of the system? Are all links valid? Are the attribute values accurate?
- Cross-reference the diagram with the actual source code or database.
- Check for orphaned links (links that point to non-existent objects).
- Ensure no circular references exist unless they are intentional (like a self-referencing object).
✨ Best Practices for Clarity and Precision
High-quality documentation relies on adherence to established practices. These guidelines help maintain the integrity of the diagrams throughout the project lifecycle.
1. Maintain Naming Conventions
Consistent naming reduces cognitive load for anyone reading the diagram. Adopt a standard format for object names across all documentation.
- Use camelCase or snake_case consistently.
- Prefix objects with their role (e.g., reqOrder vs resOrder).
- Avoid generic names like obj1 or temp1.
2. Limit Complexity
Object diagrams can become messy quickly if too many instances are included. Limit the scope to the most critical relationships.
- Group related objects if the diagram is too large.
- Use separate diagrams for different subsystems.
- Focus on the primary flow of data rather than secondary connections.
3. Use Color Strategically
While color is not part of the strict UML standard, using color in documentation tools can enhance readability.
- Use color to distinguish between different types of relationships (e.g., aggregation vs association).
- Highlight critical objects that are the focus of the documentation.
- Ensure the color scheme is accessible and does not rely solely on color to convey meaning.
4. Document Multiplicity Clearly
Multiplicity is often a source of error. Ensure that the numbers at the ends of links are accurate.
- Use 0..1 for optional relationships.
- Use 1..* for mandatory one-to-many relationships.
- Use 0..* for optional many-to-many relationships.
- Verify these match the database schema or API contracts.
⚠️ Common Errors to Avoid
Avoiding pitfalls is just as important as following best practices. These common mistakes frequently degrade the quality of technical documentation.
- Confusing Classes with Objects: Do not list class names without the instance prefix. Every object must have a specific name.
- Ignoring Null Values: If an attribute is null, it is better to omit it than to write “null” unless the presence of the attribute itself is significant.
- Overloading the Diagram: Do not try to show every possible state in one diagram. Split complex scenarios into multiple views.
- Incorrect Link Direction: Ensure the arrowheads point in the correct direction of navigation or ownership.
- Outdated Data: An object diagram becomes obsolete quickly. Ensure it is updated whenever the system state changes significantly.
🏗️ Integration with System Design
Object diagrams do not exist in isolation. They are part of a larger ecosystem of design documents. Integrating them properly enhances the overall documentation quality.
1. Alignment with Sequence Diagrams
Sequence diagrams show the flow of messages over time. Object diagrams can provide the static context for these flows. If a sequence diagram shows a message sent from Object A to Object B, the object diagram should show the link between them.
- Verify that objects in sequence diagrams exist in the object diagram.
- Use object diagrams to explain the state of objects before and after a sequence of interactions.
2. Relationship to State Diagrams
State diagrams describe the lifecycle of a single object. Object diagrams describe the collection of objects at a point in time. Together, they provide a complete picture of system behavior.
- Ensure the states of objects in the diagram match the valid states in the state diagram.
- Use object diagrams to show which objects are in which states simultaneously.
3. Supporting API Documentation
When documenting APIs, object diagrams can illustrate the payload structures returned by endpoints. This helps frontend developers understand the data they will receive.
- Show the root object and its nested children.
- Include example values for fields.
- Highlight required fields vs optional fields.
🔄 Maintenance and Versioning
Documentation is a living artifact. As the system evolves, the diagrams must evolve with it. Neglecting maintenance leads to technical debt in the documentation itself.
1. Version Control
Treat diagrams as code. Store them in version control systems to track changes over time.
- Commit changes with descriptive messages.
- Link diagram versions to specific software releases.
- Archive old diagrams rather than deleting them, in case of regression.
2. Automated Updates
Where possible, generate diagrams from the code or database schema. This reduces the gap between the code and the documentation.
- Use scripts to extract class structures and generate base diagrams.
- Manually annotate specific instance values that cannot be generated automatically.
- Set up checks to alert the team when the code diverges from the diagram.
3. Review Cycles
Establish a regular review cycle for documentation. This ensures that outdated information is caught and corrected.
- Review diagrams during sprint planning or code reviews.
- Ask developers to verify the accuracy of the diagrams during pull requests.
- Update diagrams when new features are deployed.
📊 Real-World Application Scenarios
Understanding when to use object diagrams is key. Here are specific scenarios where they add the most value.
1. Debugging Complex Data Structures
When a bug involves unexpected data relationships, an object diagram can visualize the actual state causing the error. This is more effective than reading logs.
- Draw the objects involved in the error.
- Show the values that caused the exception.
- Compare this with the expected object diagram.
2. Database Migration Planning
Before migrating a database, understanding the current instance relationships helps in planning the migration script.
- Map current object links to new table relationships.
- Identify orphaned data that needs cleanup.
- Visualize the impact of schema changes on existing data.
3. Onboarding New Developers
New team members often struggle with how data flows between components. Object diagrams provide a concrete starting point.
- Provide diagrams of the core domain entities.
- Annotate links with role names.
- Use these diagrams as a reference for understanding the domain model.
🛡️ Security and Sensitive Data Considerations
When creating documentation diagrams, security is a concern. Object diagrams often show data values, which may include sensitive information.
- Mask Sensitive Values: Replace real passwords, tokens, or PII (Personally Identifiable Information) with placeholders like “***” or “[REDACTED]”.
- Control Access: Store diagrams in secure repositories accessible only to authorized personnel.
- Audit Trails: Keep a log of who accesses and modifies the documentation.
- Environment Specifics: Do not use production data snapshots for diagrams shared publicly. Use sanitized test data.
📝 Summary of Technical Guidelines
Creating accurate UML object diagrams requires attention to detail and adherence to standards. By focusing on instances rather than classes, and by maintaining strict consistency in notation, technical writers and architects can produce documentation that truly adds value.
- Use italicized and underlined names for objects.
- Separate instance names from class names with a colon.
- Display actual attribute values, not just types.
- Ensure links reflect actual associations.
- Keep diagrams focused and avoid clutter.
- Update diagrams regularly to match system state.
- Mask sensitive data to maintain security.
Following these guidelines ensures that the documentation remains a reliable resource for the development team and stakeholders. The effort invested in precision pays off in reduced misunderstandings and more efficient development cycles.
🚀 Future Considerations
As software systems become more distributed and microservice-oriented, the role of object diagrams may shift. They may become less about static snapshots and more about dynamic state visualization in real-time monitoring tools. However, the fundamental principles of representing instances and relationships remain constant.
Staying current with evolving documentation standards ensures that object diagrams continue to serve their purpose effectively. Regular training for the documentation team helps maintain high standards.
The goal is not just to create a diagram, but to create a tool that aids understanding. Whether used for onboarding, debugging, or design review, a well-crafted object diagram provides clarity in a complex environment.