This is a demo site showcasing flipbooks created with Visual Paradigm Online.

UML Object Diagrams in Microservices Architecture

Designing complex distributed systems requires more than just code. It demands clear visualization of how components interact at runtime. While UML Class Diagrams define structure, UML Object Diagrams capture the specific state of an instance at a given moment. In the context of Microservices Architecture, understanding these runtime snapshots is vital for debugging, scaling, and maintaining system integrity. This guide explores how to model active service instances, data states, and inter-service dependencies using object diagrams.

Infographic explaining UML Object Diagrams in Microservices Architecture: compares Class Diagrams (blueprint) vs Object Diagrams (runtime snapshot), illustrates microservices instance visualization with OrderService, PaymentService, and InventoryService examples, highlights four key benefits (runtime visibility, dependency mapping, debugging aid, documentation), shows relationship types (Association, Aggregation, Dependency, Realization) with icons, demonstrates order fulfillment flow with sync/async connections, and shares best practices for scaling, annotation, and observability integration. Flat design with black outlines, pastel colors, rounded shapes, and student-friendly layout optimized for social media and educational use.

🧩 Understanding the Core Concepts

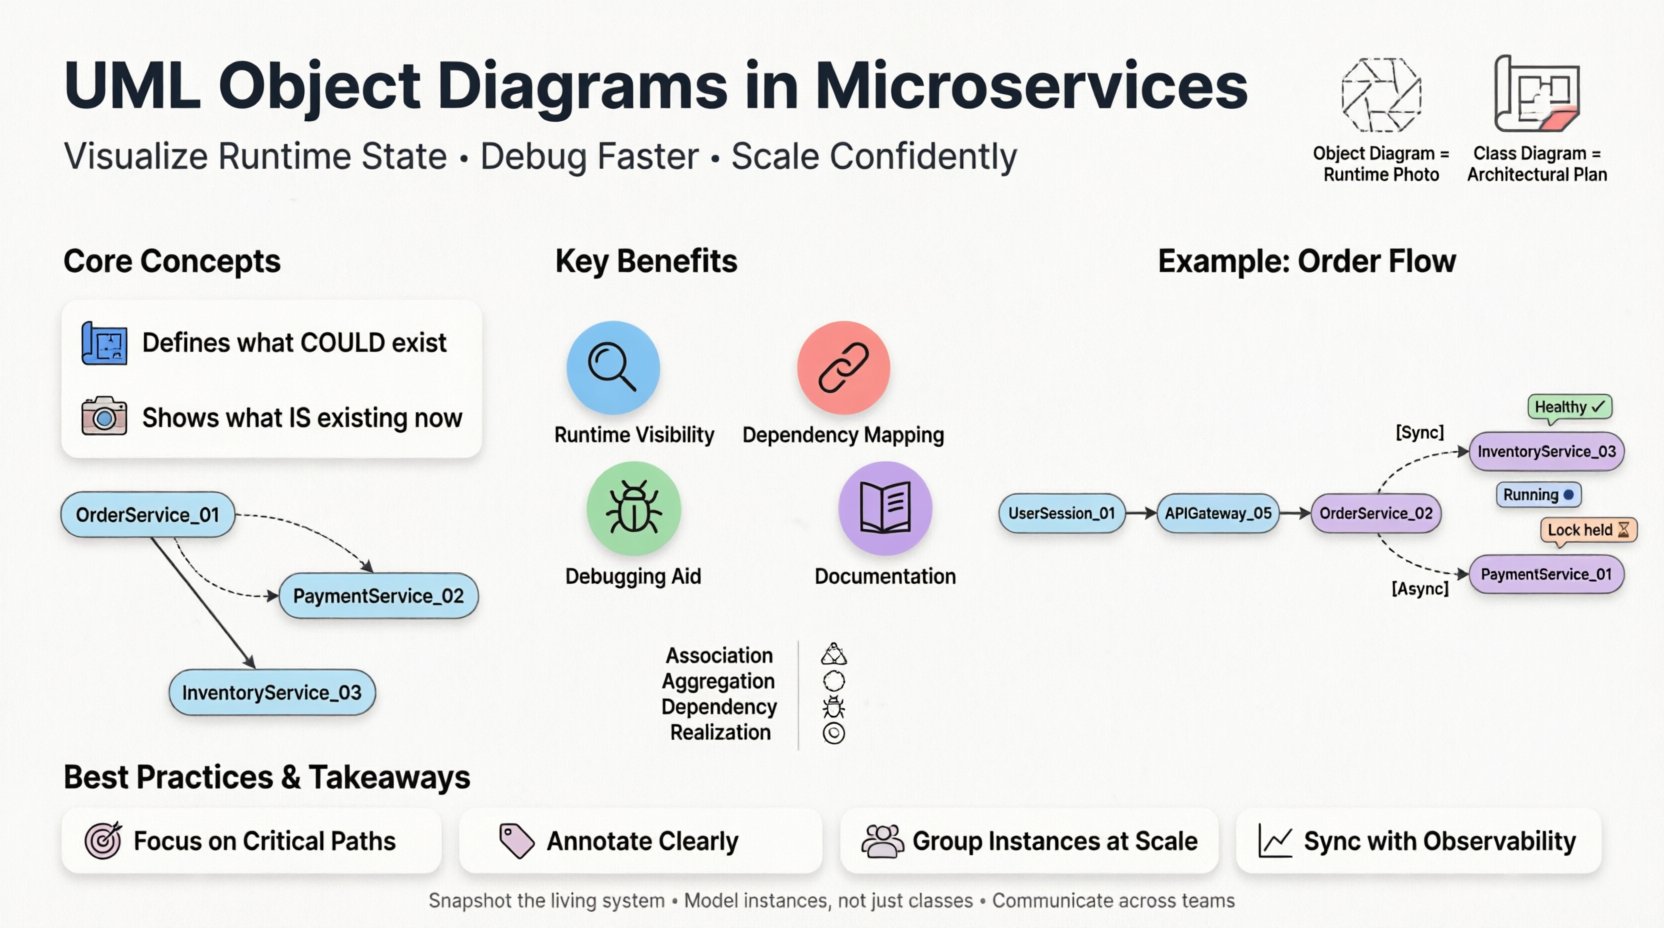
Before diving into microservices, one must distinguish between static and dynamic modeling. A class diagram acts as a blueprint. It shows what could exist. An object diagram shows what is existing right now. In a monolithic application, this distinction is manageable. In a microservices environment, the volume of active instances explodes.

Static vs. Dynamic Representation

  • Class Diagram: Defines the contract. It specifies attributes, methods, and relationships for a service module.
  • Object Diagram: Represents a snapshot. It shows specific instances of those services, their current property values, and active connections.

Think of a class diagram as the architectural plan for a house. The object diagram is a photograph of the house while people are living inside it, showing which lights are on and which doors are open.

🏗️ Microservices Context

Microservices break applications into loosely coupled, independently deployable units. Each unit, or service, can have multiple running instances. An object diagram helps visualize the topology of these instances.

Why Use Object Diagrams Here?

  • Runtime State Visibility: Helps developers see how data flows between specific service instances during an operation.
  • Dependency Mapping: Clarifies which service instance is calling which other instance.
  • Debugging Aid: When a transaction fails, an object diagram can pinpoint the exact instance holding the error state.
  • Documentation: Provides a static record of a specific deployment scenario or failure mode.

🔗 Modeling Relationships in Distributed Systems

In a monolith, objects live in the same memory space. In microservices, objects (or service instances) live in different network nodes. The relationships change significantly.

Association and Aggregation

Standard UML relationships still apply, but their implications differ.

  • Association: Indicates a link between two service instances. For example, a Order Service Instance A is linked to a Inventory Service Instance B.
  • Aggregation: A “has-a” relationship where the lifecycle is independent. A Gateway Instance aggregates requests from multiple Backend Instances.
  • Composition: A strong “part-of” relationship. Rare in microservices due to independence, but useful for modeling data ownership where a Transaction Object cannot exist without its Parent Service Context.

Table: Relationship Types in Microservices

Relationship Meaning Microservices Example
Association Connection between instances Client calls API Gateway
Aggregation Weak ownership Cache Service holds data for App Service
Dependency One uses another Notification Service depends on User Service
Realization Interface implementation Payment Service implements Payment Interface

🖥️ Visualizing Service Instances

Creating an object diagram for microservices involves representing active instances rather than abstract classes. Each node in the diagram represents a running process or container.

Attributes of an Instance

When modeling a service instance, you must define what makes it unique at that moment.

  • Instance ID: A unique identifier for the specific running process.
  • State: Is the service Healthy, Starting, Stopping, or Error?
  • Load: Current CPU or memory usage metrics (optional for high-level design).
  • Configuration: Which environment settings are active (e.g., Production vs. Staging)?

Example Structure

Consider a simplified Order Processing System. An object diagram would show:

  • OrderService_01: State = Running. Active Orders = 150.
  • PaymentService_02: State = Running. Pending Transactions = 5.
  • DatabaseInstance_A: State = Connected. Capacity = 80%.

Lines connecting these objects represent network calls or message queue subscriptions. This visualizes the actual traffic flow, not just the capability to flow.

🔄 Handling Dynamic State

The most significant challenge with object diagrams in microservices is volatility. Instances spin up and down rapidly. A snapshot today may be invalid tomorrow.

Static vs. Dynamic Snapshots

To manage this, distinguish between two types of object diagrams:

  1. Deployment Diagrams (Static): Shows the infrastructure. Servers, networks, and potential instances.
  2. Runtime Object Diagrams (Dynamic): Shows the active state during a specific transaction.

Use case: You are investigating a latency spike. You generate a runtime object diagram for the specific time window. You see Service X waiting on a lock held by Service Y. This is actionable intelligence.

📝 Data Models and Object States

Microservices often own their data. The object diagram helps visualize how data objects are distributed across services.

Domain Objects

Instead of a shared database, each service manages its own domain objects. An object diagram clarifies which service owns which data entity.

  • User Object: Owned by Identity Service.
  • Cart Object: Owned by Commerce Service.
  • Invoice Object: Owned by Billing Service.

Relationships between these objects are often asynchronous. The object diagram should reflect this via dashed lines or specific annotations indicating eventual consistency.

Table: Data Ownership Patterns

🚧 Challenges and Limitations

While powerful, object diagrams have limitations in high-scale distributed systems. Being aware of these prevents misuse.

Scale Complexity

If a system has 500 instances of a single service, drawing an object diagram for all of them is impossible. You must abstract.

  • Grouping: Represent 100 instances as a single “Pool” object with a label indicating count.
  • Sampling: Draw a representative subset of instances to show interaction patterns.
  • Abstraction: Focus on the critical path, not the background workers.

Statelessness

Many microservices are designed to be stateless. This reduces the need for complex object diagrams, as there is no local state to track. However, stateless services still interact with stateful resources (caches, databases). The diagram should focus on those resources.

Real-Time Updates

Manually updating an object diagram as services scale is not feasible. Automation tools are required to extract runtime data and generate these diagrams dynamically.

🛠️ Best Practices for Implementation

To get value from these diagrams, follow specific guidelines.

1. Focus on Critical Paths

Do not diagram every service. Diagram the flow of a critical business transaction, such as “Place Order” or “Process Refund”. This keeps the diagram readable and useful.

2. Annotate Clearly

Use text annotations to explain the state. For example:

  • [Sync]: Synchronous HTTP call.
  • [Async]: Message queue event.
  • [Timeout]: Connection established but waiting.

3. Version Control Documentation

Store these diagrams alongside code repositories. When an API changes, the object diagram should be updated to reflect the new instance relationships.

4. Integrate with Observability

Connect your diagramming process to monitoring tools. When a metric breaches a threshold, the system can suggest or generate the relevant object diagram for the incident.

🔄 Integration with Design Patterns

Certain architectural patterns align well with object diagrams.

Service Mesh

In a service mesh architecture, traffic is managed by sidecar proxies. An object diagram can show the sidecar instance attached to the main service instance. This visualizes the traffic interception points.

Circuit Breaker

When a service fails, a circuit breaker opens. The object diagram can represent the state of the breaker (Open, Closed, Half-Open) as an attribute of the service instance object. This helps visualize resilience mechanisms.

Event Bus

Services often communicate via an event bus. The object diagram should show the event bus as a central object node, with associations radiating out to subscriber services. This clarifies the publish-subscribe topology.

📈 Lifecycle of an Object Instance

An object diagram captures a moment, but understanding the lifecycle adds depth.

  • Creation: How is the instance spawned? (Orchestrator, Manual, Auto-scaling).
  • Initialization: Configuration loading, connection pooling.
  • Execution: Processing requests, holding locks.
  • Termination: Graceful shutdown, resource cleanup.

Mapping these states to object attributes helps in debugging startup failures or resource leaks.

🔍 Case Study: Order Fulfillment Flow

Let’s visualize a specific scenario without naming specific tools.

Scenario: A user places an order.

Active Instances:

  • UserSession_01: Client browser state.
  • APIGateway_05: Entry point handling the request.
  • OrderService_02: Core logic processing.
  • InventoryService_03: Checking stock levels.
  • PaymentService_01: Authorizing funds.

Relationships:

  • UserSession_01APIGateway_05 (HTTP Request)
  • APIGateway_05OrderService_02 (Forwarded Request)
  • OrderService_02InventoryService_03 (Synchronous Check)
  • OrderService_02PaymentService_01 (Asynchronous Event)

In the object diagram, you would see InventoryService_03 holding a lock on the item record. OrderService_02 is waiting for the response. If InventoryService_03 is overloaded, this diagram reveals the bottleneck.

🤝 Collaboration and Team Alignment

These diagrams serve as a common language between developers, architects, and operations teams.

  • Developers: Understand which service to modify for a specific feature.
  • Architects: Validate that the runtime state matches the design intent.
  • Operations: Understand dependencies for deployment windows and maintenance.

When teams agree on the notation and the level of detail, communication barriers drop. Ambiguity regarding which instance handles a specific request is reduced.

🧪 Testing Implications

Object diagrams can guide testing strategies.

  • Integration Testing: Use the diagram to identify all connected instances that must be active during a test.
  • Chaos Engineering: Simulate the failure of a specific node shown in the diagram to test resilience.
  • Load Testing: Model how many instances are needed to support a target load based on the object relationships.

🔮 Future Considerations

As systems evolve, so do the modeling techniques.

Serverless Architectures

In serverless environments, instances are ephemeral. Object diagrams become harder to maintain. Focus on the function flow rather than the instance state.

Edge Computing

With compute moving to the edge, instances are geographically distributed. Object diagrams must include location attributes to understand latency implications.

📌 Summary of Key Takeaways

  • Snapshot Capability: Object diagrams show runtime state, not just potential structure.
  • Instance Focus: In microservices, model specific running instances, not just abstract classes.
  • Relationship Clarity: Distinguish between synchronous calls and asynchronous events.
  • State Management: Track the lifecycle and health state of each service object.
  • Abstraction: Group instances when scale makes individual nodes unreadable.
  • Documentation: Keep diagrams synchronized with the actual deployed environment.

🛡️ Security and Object Diagrams

Security is often an afterthought in diagrams, but it should be explicit.

  • Authentication: Indicate which instances require token validation.
  • Authorization: Show which service has access to which data object.
  • Encryption: Mark connections that require TLS/SSL.

By including these attributes, the diagram becomes a security review tool as well as a design tool.

🔗 Conclusion

UML Object Diagrams provide a necessary lens for viewing the complexity of microservices. They move beyond theoretical blueprints to show the living, breathing state of a distributed system. By focusing on active instances, relationships, and states, teams can build more resilient architectures. While the dynamic nature of these systems presents challenges, the clarity gained through proper modeling is invaluable. Use them to diagnose issues, plan scaling, and communicate design intent across the organization.

Leave a Reply

Your email address will not be published. Required fields are marked *

Pattern Description Diagram Representation
Database per Service Each service has private DB Separate object nodes for DBs
Shared Database Multiple services access one DB Multiple associations to one DB object
API Composition Service A calls Service B for data Dependency arrow from A to B