In the complex landscape of software architecture, clarity is currency. Teams often struggle to align on how data and objects interact at a specific moment in time. While class diagrams provide the blueprint, they lack the specificity of a snapshot. This is where UML Object Diagrams become essential. They offer a static view of the system, focusing on instances rather than definitions.
When teams collaborate effectively, they need shared mental models. Visualizing object instances helps bridge the gap between abstract design and concrete implementation. This guide explores how to leverage these diagrams for better communication, reduced ambiguity, and stronger system integrity.
🧩 Understanding the Object Diagram
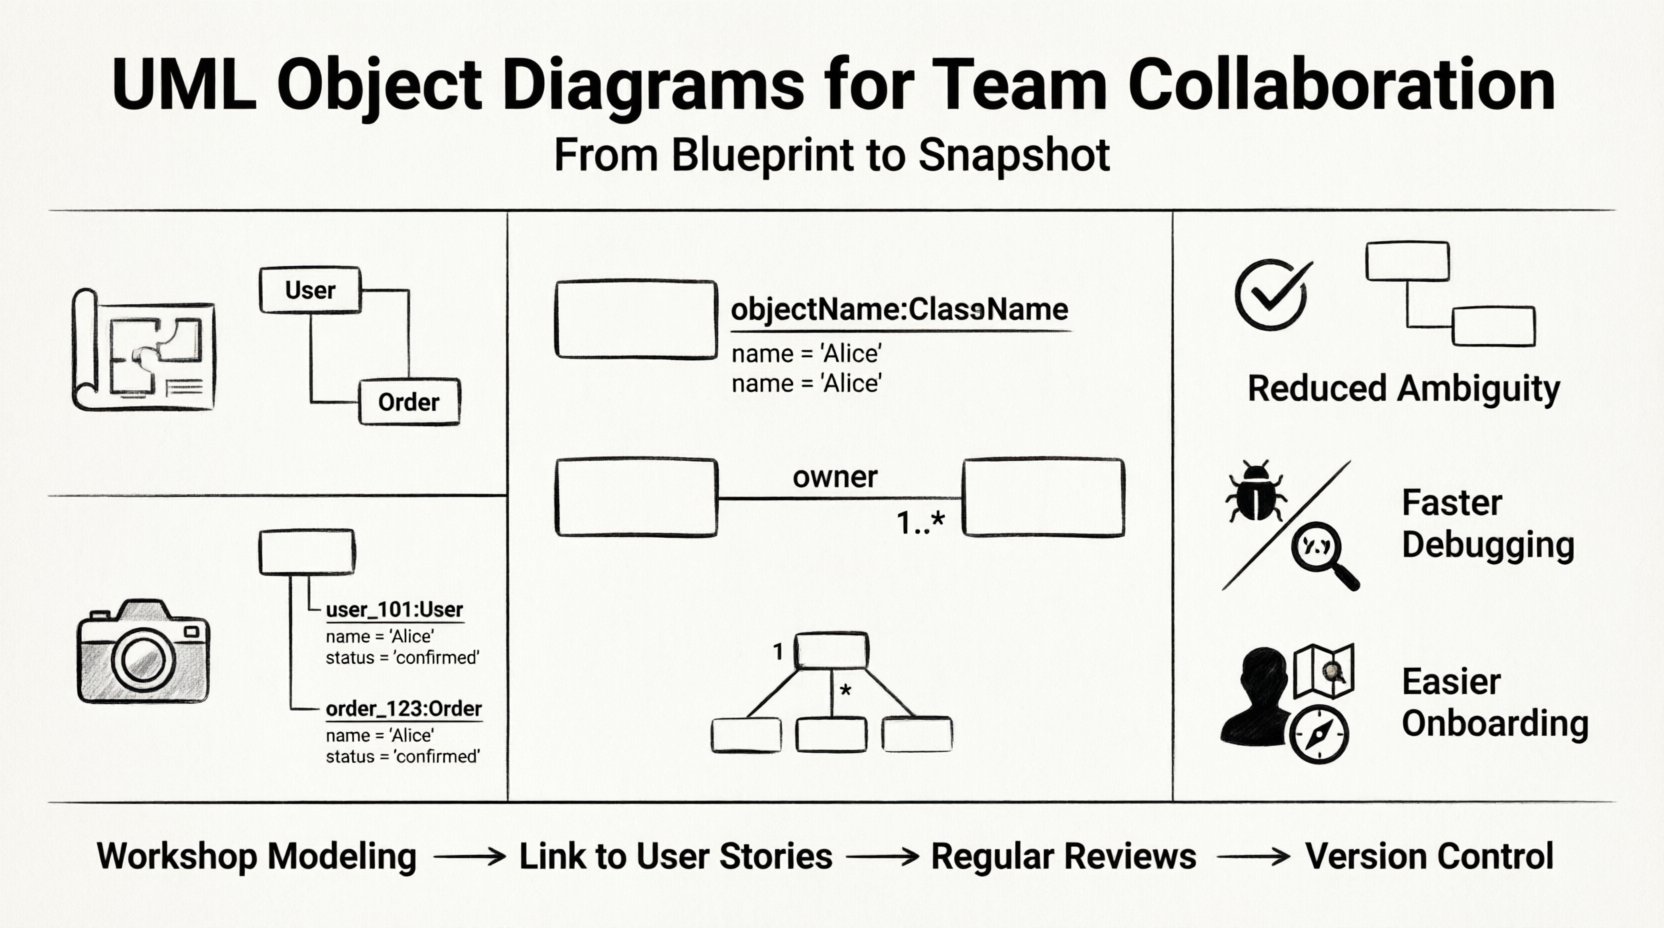
An object diagram is a type of static structure diagram in the Unified Modeling Language. It describes the structure of a system by showing a particular set of objects and their relationships. Think of a class diagram as the architectural plan for a building, and an object diagram as a photograph of the building after it has been constructed. The photograph captures the state at a specific moment.
- Instances: Unlike class diagrams that define types, object diagrams focus on specific instances. For example, instead of a generic “User” class, an object diagram might show “user_101” with specific attributes populated.
- Links: These represent the connections between objects. Links are the runtime manifestations of associations defined in class diagrams.
- Multiplicity: This defines how many instances of one object can be linked to another. It is crucial for understanding constraints during runtime.
Why does this matter for collaboration? Because developers often have different interpretations of how data flows. A diagram showing actual instances forces the team to agree on the state of the system, reducing the risk of integration errors later.
👥 Why Teams Need Visual Snapshots
Software development is a team sport. Miscommunication between architects, developers, and stakeholders leads to technical debt and rework. Object diagrams serve as a universal language that transcends specific coding languages.
1. Reducing Ambiguity
Textual descriptions of data relationships can be vague. Phrases like “the system handles many users” are open to interpretation. An object diagram explicitly shows how many and which specific entities are involved in a scenario.
- Clarity: Visual representations are processed faster by the human brain than text.
- Precision: Every link and role name must be defined, forcing precision in thinking.
- Verification: Teams can verify if the implementation matches the intended design at runtime.
2. Facilitating Debugging Sessions
When bugs occur, they often relate to state issues. Object diagrams allow the team to sketch out the expected state of the system when an error happens. This helps isolate whether the problem lies in logic, data flow, or structural configuration.
3. Onboarding New Members
New team members often struggle with complex legacy systems. Object diagrams provide a quick entry point to understand the current state of the system without reading thousands of lines of code. They act as a map for the territory.
🛠️ Anatomy and Syntax of Object Diagrams
To collaborate effectively, everyone must speak the same syntax. The notation for object diagrams is distinct yet closely related to class diagrams. Understanding the elements is the first step toward mastery of the tool.
Object Notation
Objects are represented as rectangles. The name of the object is underlined and written in the format objectName:ClassName. Attributes are listed below the name, showing their current values.
- Instance Name: Always underlined to distinguish it from a class name.
- Type Name: The class it belongs to (e.g.,
order_123:Order). - Attribute Values: Shown as
attributeName: value.
Link Notation
Links connect objects. They are lines that can have role names and multiplicity constraints at either end.
- Role Name: Indicates the part an object plays in the relationship (e.g., “customer” vs. “provider”).
- Multiplicity: Defines the number of objects (e.g., 1, 0..*, 1..3).
- Direction: While links are bidirectional, arrows can be used to indicate navigation paths.
Comparison: Class vs. Object Diagrams
Understanding when to use which diagram is critical for maintaining documentation hygiene. Overusing object diagrams can lead to maintenance nightmares, while underusing them can lead to confusion.
| Feature | Class Diagram | Object Diagram |
|---|---|---|
| Focus | Definition of types | Instances at runtime |
| Stability | High (changes rarely) | Low (changes frequently) |
| Use Case | System architecture design | Scenario visualization, debugging |
| Notation | Class Name | objectName:ClassName |
| Maintenance | Easy to maintain | Requires updates on every change |
🤝 Collaboration Strategies
Creating diagrams is not a solitary task. The value lies in the discussion that happens while creating them. Teams should adopt specific workflows to ensure object diagrams remain useful artifacts rather than forgotten documents.
1. Workshop-Based Modeling
Organize dedicated sessions where the team gathers to model a specific scenario. This could be a user story or a complex transaction flow.
- Facilitation: Assign a moderator to keep the discussion focused on the diagram structure, not the code implementation.
- Tools: Use whiteboards or collaborative digital canvases to allow real-time input from all members.
- Validation: Review the diagram against the requirements to ensure no relationships are missing.
2. Integration with User Stories
Link object diagrams directly to user stories in the project management backlog. This ensures that the model evolves with the product.
- Traceability: When a story is updated, the associated diagram should be reviewed.
- Acceptance Criteria: Include the diagram as part of the definition of done for complex features.
- Context: Ensure the diagram provides context for the specific story, not the entire system.
3. Regular Reviews
Set a cadence for reviewing diagrams. As the system evolves, old snapshots become inaccurate. Regular reviews prevent documentation drift.
- Frequency: Monthly or per sprint, depending on project velocity.
- Participants: Involve developers, architects, and QA engineers.
- Focus: Identify areas where the current code structure diverges from the documented model.
🔗 Integration with Class Diagrams
Object diagrams do not exist in a vacuum. They rely on the definitions provided by class diagrams. The relationship between the two is one of definition versus instantiation.
The Blueprint and the Snapshot
The class diagram defines the rules. The object diagram shows a game played under those rules. If the rules change, the game changes. If the game state changes, the rules remain the same.
- Consistency: Ensure that every object in the diagram corresponds to a defined class.
- Extensions: Use object diagrams to explore edge cases that might not be visible in the general class structure.
- Validation: Use object diagrams to validate that the class definitions allow for the necessary runtime configurations.
Handling Aggregation and Composition
These relationships are often where confusion arises. Object diagrams clarify ownership and lifecycle.
- Composition: Shows strong ownership. If the parent object is destroyed, the child objects are destroyed. In a diagram, this is a filled diamond.
- Aggregation: Shows weak ownership. Child objects can exist independently. In a diagram, this is an empty diamond.
Clarifying these relationships during team modeling sessions prevents resource management bugs and memory leaks.
🚀 Real-World Scenarios
To understand the practical application, consider specific scenarios where object diagrams provide distinct value over other documentation methods.
1. E-Commerce Transaction Flow
In a shopping cart system, understanding the state of an order is critical. An object diagram can show a specific order instance linked to a customer, a payment gateway, and inventory items.
- Scenario: A customer attempts to checkout with out-of-stock items.
- Diagram Utility: Visualize the link between the Order object and the Inventory object at the moment of failure.
- Benefit: Helps QA teams reproduce the exact state that causes the error.
2. Microservices Interaction
In distributed systems, objects may be distributed across different services. Object diagrams can map out the logical connections between instances across service boundaries.
- Scenario: A user request triggers a notification service.
- Diagram Utility: Show the “NotificationRequest” object instance linking to the “User” instance in Service A and the “EmailService” instance in Service B.
- Benefit: Clarifies data ownership and latency points.
3. Security Permission Models
Access control often relies on specific instance relationships. Who has access to what data?
- Scenario: A user attempts to access a document owned by another user.
- Diagram Utility: Map the “User” instance to the “Document” instance and the “Permission” instance.
- Benefit: Helps auditors verify that the logic enforces the policy correctly.
🛡️ Maintenance and Evolution
One of the greatest challenges with object diagrams is their volatility. Because they represent runtime states, they change as frequently as the data does. If not managed, they become stale and misleading.
1. Avoid Over-Modeling
Do not try to diagram every possible state. Focus on critical paths and complex interactions. Creating a diagram for every minor update is unsustainable.
- Scope: Limit diagrams to specific use cases or modules.
- Abstraction: Use placeholders for generic data that does not affect logic.
2. Version Control
Treat diagrams as code. Store them in the repository alongside the source code. This ensures that diagram versions align with code versions.
- Commit Messages: Reference diagram updates in commit messages.
- Branching: Create branches for significant architectural changes that require diagram updates.
3. Automated Validation
Whenever possible, use tools to validate that the code adheres to the model. This reduces the manual burden of keeping diagrams accurate.
- Code Generation: Generate skeleton code from class diagrams to ensure consistency.
- Static Analysis: Run tools that check for structural inconsistencies.
🚧 Overcoming Hurdles
Even with the best intentions, teams face obstacles. Recognizing these common hurdles allows for proactive mitigation.
1. Resistance to Documentation
Developers often prefer coding over documenting. They may view diagrams as overhead.
- Solution: Show tangible benefits. Use diagrams to solve a real bug or clarify a requirement during a meeting.
- Integration: Make diagramming part of the collaborative design process, not a separate task.
2. Tool Fatigue
Using different tools for code and diagrams creates friction.
- Solution: Select tools that integrate with the existing development environment.
- Standardization: Agree on a single standard for notation and storage.
3. Lack of Domain Knowledge
Team members may not understand the business domain well enough to model objects correctly.
- Solution: Include domain experts in the modeling sessions.
- Workshops: Dedicate time to educate the team on business rules before modeling.
📈 Measuring Success
How do you know if collaborative modeling is working? Look for specific indicators of improved efficiency and quality.
- Reduced Rework: Fewer changes required after code review due to better upfront understanding.
- Faster Onboarding: New hires spend less time deciphering the system architecture.
- Clearer Communication: Fewer meetings spent clarifying basic requirements.
- Better Bug Tracking: Issues are reported with clearer context using diagram references.
🔄 Continuous Improvement
Modeling is a cycle, not a destination. As the system evolves, the diagrams must evolve with it. The goal is not perfection, but alignment. When the team looks at a diagram and sees the system they are building, the modeling effort has succeeded.
By focusing on instance relationships, maintaining clear syntax, and integrating diagrams into the daily workflow, teams can transform abstract concepts into concrete understanding. This shared understanding is the foundation of robust, scalable software systems.
Start small. Pick a complex interaction. Draw the objects. Discuss the links. Refine the model. Repeat. Over time, this practice builds a culture of clarity and precision that permeates the entire development lifecycle.