Understanding the structure of data is fundamental to building robust software systems. While Class Diagrams provide the blueprint, Object Diagrams offer a concrete snapshot of how data actually behaves at a specific moment in time. In the context of database design, these diagrams serve as a critical bridge between abstract logical models and physical data storage. They allow architects to visualize instances, relationships, and constraints before a single line of code is written or a table is created. This guide explores the mechanics, applications, and strategic value of using UML Object Diagrams for database design and modeling.
🔍 Understanding the Role of Object Diagrams
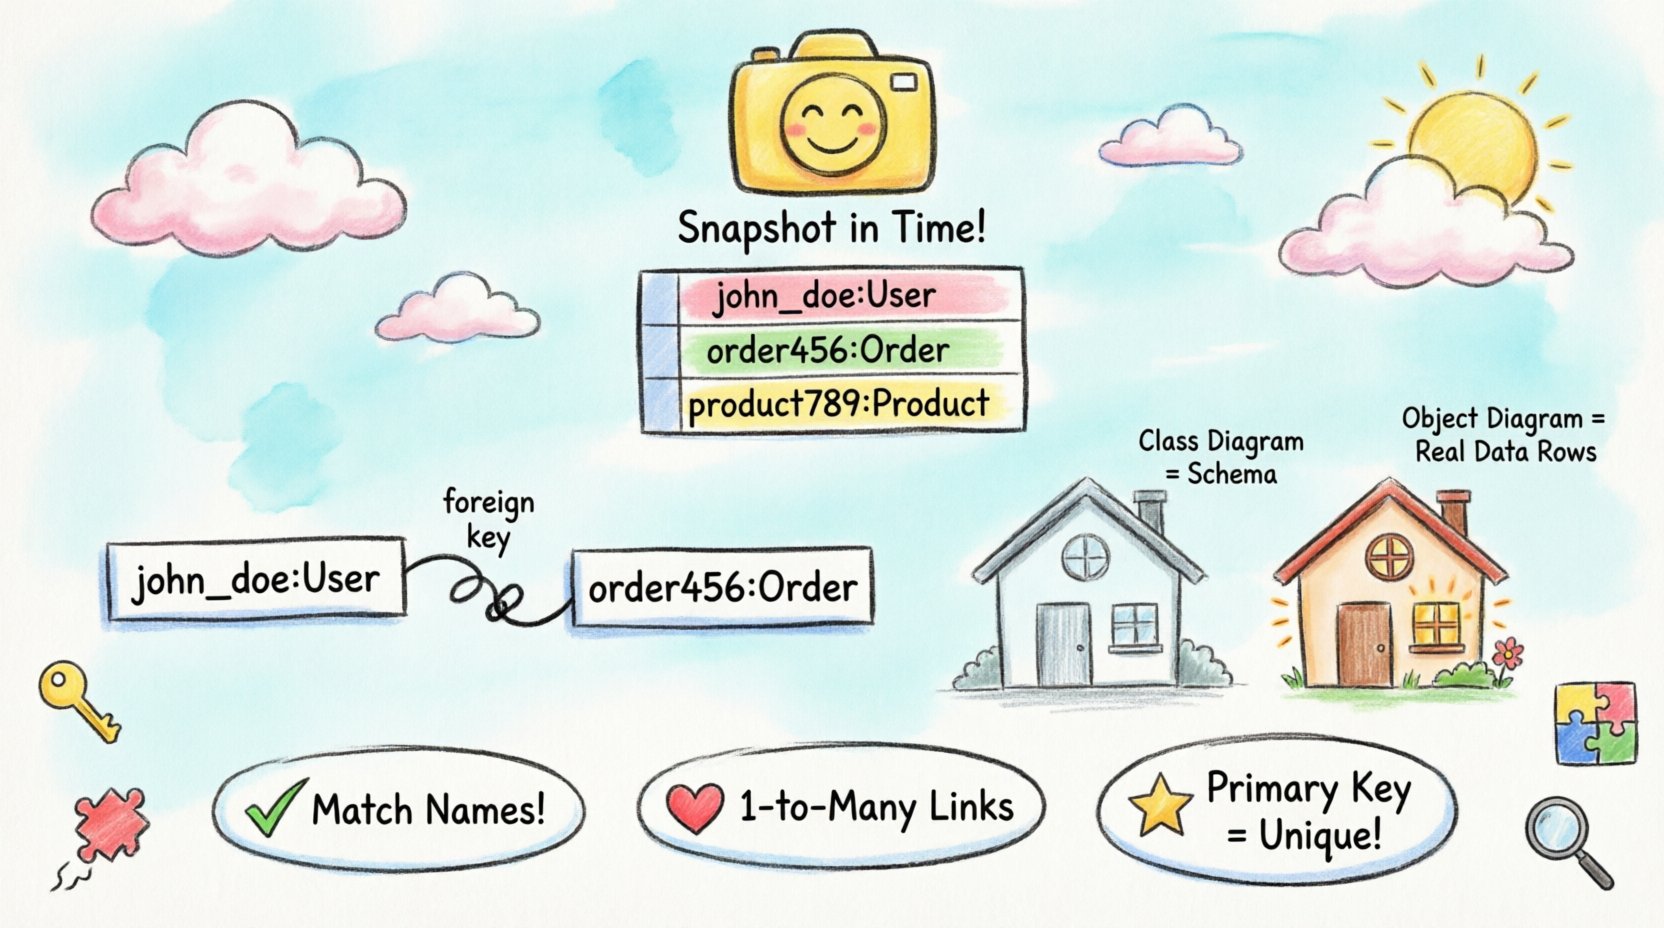
An Object Diagram represents a snapshot of the system at a specific point in time. Unlike a Class Diagram, which defines the types and structures available, an Object Diagram defines the actual instances that exist within the runtime environment. When applied to database design, this distinction is vital. A database schema is essentially a Class Diagram, but the data residing within it is a collection of Object Diagrams.
- Static Structure: Object diagrams focus on the static structure of objects and their relationships.
- Instance Specific: They name specific objects rather than generic classes.
- Snapshot View: They represent the state of the database at a particular moment.
- Validation: They help validate that the schema supports the required data instances.
By visualizing data instances, designers can identify potential issues such as orphaned records, invalid reference states, or cardinality violations before they become production problems. This proactive approach reduces technical debt and ensures data integrity.
🆚 Class Diagrams vs. Object Diagrams
Confusion often arises between Class Diagrams and Object Diagrams. While both are part of the Unified Modeling Language (UML) and depict static structure, their purpose and notation differ significantly. For database modeling, understanding this distinction ensures the correct level of abstraction is used at each stage of development.
| Feature | Class Diagram | Object Diagram |
|---|---|---|
| Focus | Defines types, attributes, and methods. | Defines specific instances of those types. |
| Labeling | Class names are italicized (e.g., Customer). | Object names are underlined (e.g., cust123:Customer). |
| Time Context | Timeless blueprint. | Snapshot at a specific time. |
| Database Mapping | Maps directly to Table definitions. | Maps to Rows and Data Values. |
| Usage | Schema design and API definition. | Data validation and debugging. |
In a relational database context, the Class Diagram dictates the CUSTOMER table schema. The Object Diagram dictates the specific rows that populate that table. If a Class Diagram says a field must be an integer, the Object Diagram shows the actual integer values present in the rows.
🛠️ Anatomy of an Object Diagram
To effectively model database instances, one must understand the specific syntax and components used in UML Object Diagrams. Each element carries semantic meaning that translates directly to database constraints and data integrity rules.
1. Object Instances
Objects are represented by rectangles. The top section contains the object name, which must be underlined to distinguish it from a class. The bottom section lists the attribute values for that specific instance.
- Format: objectName:ClassName
- Example: john_doe:User
- Attribute Values: These display the actual data, such as
email: "[email protected]"orstatus: "active".
2. Links
Links represent the connections between objects. In database terms, these correspond to foreign keys and relationships. A link connects two specific object instances, not just their classes.
- Association: A generic line connecting two objects.
- Role Names: Labels on the line indicate the nature of the relationship from the perspective of each object.
- Multiplicity: Constraints shown on the link define cardinality (e.g., one-to-many).
3. Aggregation and Composition
These are specialized types of relationships that define ownership and lifecycle.
- Aggregation: A weak relationship where the part can exist independently of the whole. In databases, this often implies a foreign key reference without strict cascading delete rules.
- Composition: A strong relationship where the part cannot exist without the whole. This maps to database constraints where a child record is deleted if the parent record is deleted (Cascading Delete).
🔄 Mapping Object Diagrams to Database Schemas
The transition from a visual Object Diagram to a physical database schema requires careful translation. While the Class Diagram maps to the schema structure, the Object Diagram validates the schema’s ability to hold real-world data. This section details how to map specific diagram elements to database constructs.
Attributes to Columns
Every attribute listed in an object instance rectangle corresponds to a column in a database table. The type of data shown in the object instance must match the data type defined in the schema.
- Primitive Types: Integer, String, Boolean in the diagram map to VARCHAR, INT, BOOLEAN in the database.
- Enumerations: If an object shows a status of “pending”, the database column must be constrained to accept only that value.
- Nullability: If an attribute is blank in the object diagram, it represents a NULL value in the database. This highlights optional fields.
Links to Foreign Keys
Links between objects are the most critical component for relational integrity. They indicate how data in one table relates to data in another.
| Diagram Element | Database Equivalent | Consideration |
|---|---|---|
| Line between Object A and Object B | Foreign Key Constraint | Ensures referential integrity. |
| Multiplicity 1..* on the link | One-to-Many Relationship | One parent, many children. |
| Role Name on link | Column Alias or Logic | Clarifies the relationship purpose. |
| Aggregation Diamond | Optional Foreign Key | Child can exist without Parent. |
| Composition Diamond | Cascading Delete | Child deleted with Parent. |
Identifiers and Keys
Object diagrams often use specific identifiers for instances. In a database, these are Primary Keys. When modeling an object, the identifier should be clearly defined to ensure uniqueness.
- Composite Keys: If an object relies on multiple attributes to be unique, the diagram should show the relationship between those attributes clearly.
- Surrogate Keys: Sometimes an object has an internal ID not visible in the business logic. The diagram should indicate if this ID is used for linking.
📐 Best Practices for Data Modeling
Creating an Object Diagram is an exercise in precision. Adhering to established best practices ensures the diagram remains a useful tool rather than a source of confusion. These guidelines apply regardless of the specific database technology used.
1. Maintain Consistency
Ensure that the naming conventions used in the Object Diagram match the database schema. If a class is named Order in the model, the table should not be named Orders_Table without a documented mapping. Consistency reduces the cognitive load during development and debugging.
2. Limit Complexity
Object diagrams can become cluttered quickly. Avoid drawing every possible instance in a system. Instead, focus on representative examples that highlight complex relationships.
- Focus on Critical Paths: Model the objects involved in the primary business processes.
- Use Groups: If there are many similar objects, group them or use ellipses to indicate additional instances without drawing them all.
- Layering: Create separate diagrams for different subsystems or domains.
3. Validate Cardinality
One of the most common errors in database design is incorrect cardinality. The Object Diagram is the perfect place to verify this. If a User object is linked to a Profile object, check the multiplicity.
- One-to-One: Ensure the database enforces uniqueness on the foreign key column.
- One-to-Many: Ensure the foreign key exists on the “many” side.
- Many-to-Many: This usually requires a junction table. The Object Diagram should show an intermediate object representing the association.
4. Document Constraints
Use notes or text boxes to document constraints that cannot be easily drawn. This includes business rules, validation logic, and default values.
- Business Rules: “A user cannot be deleted if they have active orders.”
- Default Values: “Status defaults to ‘inactive’.”
- Indexes: Indicate which attributes are frequently queried and should be indexed.
⚠️ Common Pitfalls and Solutions
Even experienced architects encounter issues when translating abstract models into concrete data structures. Recognizing these pitfalls early can save significant time during implementation.
1. Over-Modeling Instances
A common mistake is trying to document every single row in a large dataset. Object diagrams are for design, not for data dumps.
- Solution: Use generic instances to represent groups. For example, userGroup1:User, userGroup2:User rather than listing every single user ID.
2. Ignoring Null Values
Database fields often allow NULL values, but Object Diagrams can imply data must always exist. If an attribute box is empty in the diagram, it implies NULL. If it has a value, it implies NOT NULL.
- Solution: Be explicit. If a field can be empty, ensure the diagram reflects that variability through different instance examples.
3. Circular References
It is possible to create circular links in an Object Diagram (Object A links to Object B, which links back to Object A). In a relational database, this can lead to infinite loops in queries or dependency issues during import.
- Solution: Review the dependency graph. Ensure that initialization order is possible. Use foreign keys carefully to break cycles if necessary.
4. Inconsistent Data Types
One object might store a date as a string, while another stores it as a timestamp. This leads to data inconsistency.
- Solution: Standardize types across all instances in the diagram. Ensure the underlying database schema enforces these types.
📈 Advanced Considerations for Scalability
As systems grow, the complexity of the Object Diagram increases. Designers must consider how the model will scale and how the diagram will remain maintainable.
1. Inheritance and Polymorphism
In object-oriented design, inheritance allows objects to share attributes. In database design, this often maps to Table Inheritance or Single Table Inheritance. The Object Diagram can show subclasses of a main object.
- Specialization: Show how a
Customerobject might have a specializedGoldCustomerobject with additional attributes. - Database Implication: Decide if this requires a separate table or just extra columns in the main table.
2. Normalization in Visualization
Normalization reduces redundancy. An Object Diagram can help visualize the impact of normalization on data access.
- Third Normal Form: If an object diagram shows an object with repeating groups, it indicates a violation of normalization rules.
- Denormalization: Sometimes, for performance, data is duplicated. The Object Diagram should clearly mark these denormalized attributes to alert developers that changes must be applied to multiple instances.
3. Versioning and Evolution
Database schemas evolve. An Object Diagram should be treated as a versioned artifact. When a new attribute is added, the diagram must be updated to reflect the new state of the instances.
- Change Logs: Maintain a history of diagram changes alongside the database migration scripts.
- Backwards Compatibility: Show how new objects interact with legacy data structures to ensure smooth transitions.
🔗 Integrating with Development Workflows
The value of an Object Diagram is realized when it is integrated into the broader development lifecycle. It should not exist in isolation.
1. Requirement Analysis
Use Object Diagrams during the requirements phase to discuss data needs with stakeholders. Visualizing actual data instances is often easier for non-technical stakeholders to understand than abstract class structures.
2. Code Generation
While the diagram describes instances, the underlying Class Diagram drives code generation. However, the Object Diagram validates that the generated code will handle the expected data correctly.
3. Testing and QA
Test data can be modeled using Object Diagrams. Before running a test suite, create an Object Diagram representing the test data state. This ensures the test environment matches the expected input for the application.
4. Documentation
Include Object Diagrams in technical documentation. They provide a quick reference for developers to understand the current state of data relationships without digging into the code.
🏁 Summary of Value
Using UML Object Diagrams for database design offers a layer of clarity that schema-only modeling cannot provide. By focusing on instances, designers can foresee data integrity issues, validate relationships, and ensure that the physical database aligns with the logical requirements of the application. The distinction between the blueprint (Class) and the building (Object) is essential for maintaining high-quality data architecture.
Adopting this approach requires discipline and attention to detail. It demands that architects think about specific data values and relationships, not just abstract types. However, the return on investment is significant. Systems built with this level of scrutiny tend to be more stable, easier to maintain, and less prone to data corruption. As you design your next database schema, consider incorporating Object Diagrams into your toolkit to visualize the life of your data before it is ever stored.