Software architecture relies heavily on clear communication. While many teams focus on the blueprint of the system, they often overlook the specific state of that system at a given moment. This is where the UML object diagram becomes essential. It captures a snapshot of the system, showing instances of classes and their relationships at a specific point in time. Unlike other diagrams that describe potential structures, this diagram describes reality within the model.
Understanding this tool allows developers and architects to validate complex logic before writing code. It bridges the gap between abstract class definitions and concrete execution. By visualizing specific instances, teams can spot potential issues with memory, references, and data flow early in the design phase.
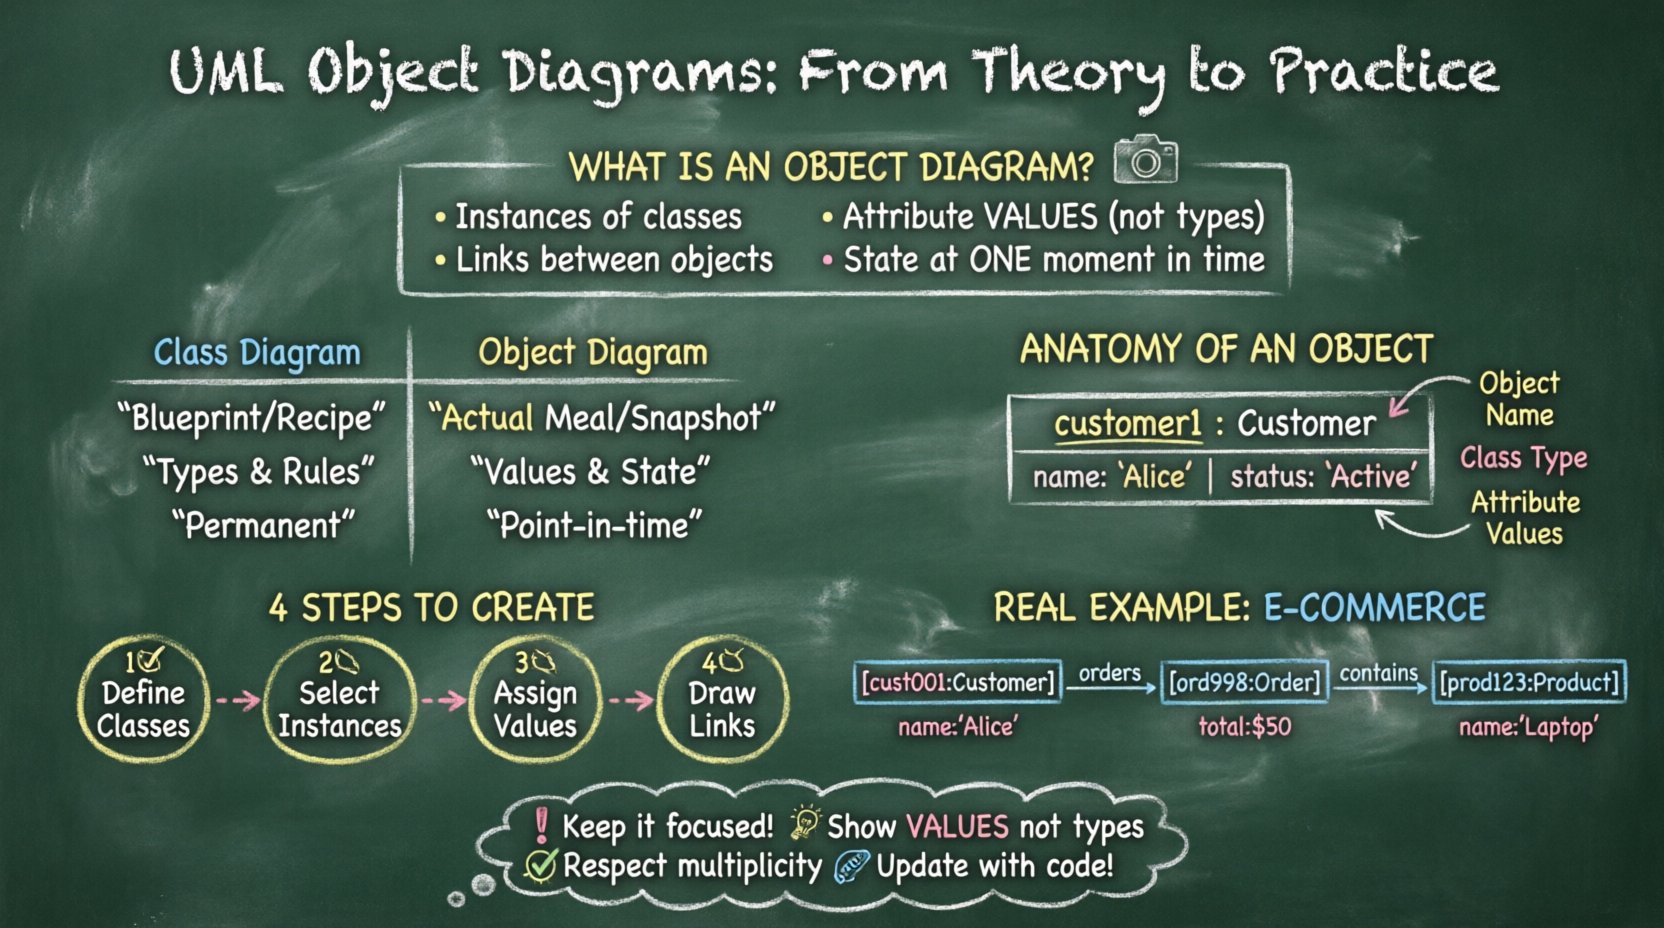
🔍 What Is an Object Diagram?
An object diagram represents a specific instance of a class diagram. While a class diagram defines the rules and types of objects, this diagram shows the actual objects interacting with each other. Think of the class diagram as a recipe and the object diagram as the actual meal prepared at a specific dinner. It displays:
- Instances: Specific objects created from classes.
- Links: Connections between these instances.
- Attributes: The values held by the instances.
- States: The condition of the objects at that moment.
This visual representation is static. It does not show the movement of data over time, but rather the structure of data at a single moment. This distinction is critical for debugging and verifying data integrity.
🏗️ Core Components and Syntax
To build an accurate diagram, one must understand the visual language used to represent the system. Every element serves a specific purpose in defining the structure.
1. Object Instances
Each box represents an object. The box is divided into two sections:
- Top Section: Contains the object name. This is usually italicized and includes the class name below it, separated by a colon. For example, customer1: Customer.
- Bottom Section: Lists the attributes and their current values. This is where you see the state. For instance, a customer object might show name: “John Doe” and status: “Active”.
2. Links and Associations
Links represent the connections between objects. They are similar to associations in a class diagram but are specific to instances. A line connecting two object boxes indicates a relationship. Labels on these lines describe the role one object plays in relation to the other.
- Multiplicity: Numbers or ranges (e.g., 1..*, 0..1) indicate how many instances are involved.
- Navigability: Arrows indicate the direction of knowledge. If an arrow points from Object A to Object B, Object A knows about Object B.
- Roles: Text labels near the ends of the link define the specific relationship name.
3. Attribute Values
In a class diagram, attributes are types. In an object diagram, attributes are values. This provides immediate context. If you are reviewing a diagram for a banking system, seeing an account balance of 0.00 versus 15000.50 changes the understanding of the system state significantly.
⚖️ Object Diagram vs. Class Diagram
Confusion often arises between these two diagram types. Both describe structure, but their scope and utility differ. The following table outlines the key distinctions.
| Feature | Class Diagram | Object Diagram |
|---|---|---|
| Focus | Abstract structure and types | Concrete instances and state |
| Lifetime | Permanent definition | Snapshot in time |
| Attributes | Shows data types | Shows specific values |
| Usage | Design phase | Validation and testing phase |
| Complexity | Low (general rules) | High (specific data) |
Using both diagrams in tandem provides a complete picture. The class diagram sets the rules, and the object diagram proves those rules work with actual data.
🛠️ How to Create an Object Diagram
Creating these diagrams requires a systematic approach. There is no specific tool required to start, though drawing software often helps. The process involves defining the class structure first, then instantiating specific objects.
Step 1: Define the Classes
Begin with the class diagram. Ensure all necessary classes are defined. You cannot create instances if the blueprint does not exist. Identify the relationships between classes, such as inheritance, composition, and aggregation.
Step 2: Select Instances
Choose which classes need to be instantiated for this specific view. You do not need to show every single object in the system. Focus on the objects relevant to the scenario you are modeling. For example, if modeling a login process, focus on the User, Session, and AuthService objects.
Step 3: Assign Values
Populate the attribute boxes with realistic data. This step is crucial for validation. If a field expects an integer, do not put text. If a field expects a date, ensure the format is correct. This practice helps identify type mismatches early.
Step 4: Draw Links
Connect the objects based on the class relationships. Ensure that the multiplicity constraints are respected. If a class relationship allows only one parent, the object diagram should not show two parents.
🧩 Practical Scenarios for Object Diagrams
These diagrams are not just theoretical exercises. They serve practical purposes in various stages of development and maintenance.
1. Debugging Complex Relationships
When a bug occurs involving data referencing, a sequence diagram might show the flow, but an object diagram shows the state. If an object is null when it should have a value, the diagram makes this visible. It helps trace why a reference failed.
2. Database Schema Verification
Before migrating data, architects often create object diagrams to represent the expected data structure. This acts as a check against the database schema. If the diagram shows a mandatory link that the database does not support, the schema needs adjustment.
3. Training and Documentation
New team members often struggle with how data flows. A class diagram is abstract. An object diagram with real values provides a concrete example. It serves as a reference for how the system behaves during normal operation.
4. API Contract Validation
When designing APIs, developers can use object diagrams to show what data is sent and received. This clarifies the payload structure without writing code. It ensures that all parties understand the data contract.
🚧 Common Mistakes to Avoid
Even experienced practitioners make errors when modeling these diagrams. Being aware of common pitfalls ensures the diagram remains a useful tool rather than a source of confusion.
- Overloading the Diagram: Trying to show every object in the system makes the diagram unreadable. Keep it focused on the specific scenario.
- Ignoring Multiplicity: Drawing links that violate the defined cardinality rules renders the diagram invalid. Always check the constraints from the class diagram.
- Inconsistent Naming: Ensure object names follow a consistent convention. Mixing user1 and User_1 creates ambiguity.
- Missing Values: Leaving attribute boxes empty defeats the purpose of showing state. Use placeholders like ? if the value is unknown, but avoid leaving them blank.
- Confusing Links with Associations: Remember that links connect instances, while associations connect classes. The visual representation is similar, but the semantic meaning differs.
🔄 Integrating with Other UML Diagrams
An object diagram does not exist in isolation. It works best when integrated with other modeling techniques.
1. Sequence Diagrams
Sequence diagrams show the flow of messages. Object diagrams show the objects receiving those messages. You can use the object diagram to verify that the objects mentioned in the sequence actually exist and have the correct relationships.
2. State Machine Diagrams
State diagrams show how an object changes over time. An object diagram captures a single state. By comparing multiple object diagrams taken at different times, you can reconstruct the state transitions shown in the state machine.
3. Component Diagrams
Component diagrams show the high-level structure. Object diagrams zoom in on the data within those components. This hierarchy helps in managing complexity by separating high-level design from low-level data details.
📊 Advanced Concepts: Composite Structures
As systems grow, simple associations become insufficient. Complex structures like composite objects require careful modeling.
1. Aggregation vs. Composition
Understanding the difference is vital for object diagrams. In composition, the child cannot exist without the parent. In the diagram, this is shown by a strong link. In aggregation, the child can exist independently. The link is weaker. Misrepresenting this can lead to memory management errors in the actual code.
2. Cycles and Loops
Sometimes objects reference each other in a cycle. Object A points to Object B, and Object B points back to Object A. This is valid in many systems but requires careful handling to avoid infinite loops during traversal. The diagram should clearly label these circular references.
3. Static Objects
Some objects exist as singletons. They are shared across the system. In the diagram, these are often represented with a specific notation or highlighted to indicate they are shared instances rather than unique ones.
🎯 Best Practices for Maintenance
Diagrams degrade over time if not maintained. To keep them useful, follow these guidelines.
- Update Regularly: If the code changes, the diagram should reflect that. Outdated diagrams are worse than no diagrams at all.
- Version Control: Treat diagrams as code. Store them in the same repository and commit changes with descriptive messages.
- Review Sessions: Include diagram reviews in sprint planning. Ensure stakeholders understand the current state.
- Keep it Simple: If a diagram becomes too complex, split it into multiple views. Do not try to cram everything into one image.
💡 Real-World Example: E-Commerce Order
Consider an online store. A class diagram defines Customer, Order, Product, and Payment. An object diagram for a specific transaction would look like this:
- Object 1: cust001: Customer. Attributes: name: “Alice”, email: “[email protected]”.
- Object 2: ord998: Order. Attributes: total: 50.00, status: “Paid”.
- Object 3: prod123: Product. Attributes: name: “Laptop”, price: 50.00.
- Link: cust001 is linked to ord998 (1 to 1). ord998 is linked to prod123 (1 to 1).
This snapshot tells a clear story. Alice bought a Laptop for 50.00 and the order is paid. A developer looking at the logs can match this structure to find the database records. If the database shows a different status, the discrepancy is immediately visible.
🔗 Navigability and Directionality
Direction matters in object modeling. It defines which object initiates the relationship. In the diagram, an arrow indicates navigability.
- Source to Target: If the arrow goes from A to B, A knows the address of B.
- Bi-directional: If both sides have arrows, both objects know each other.
- No Arrow: In some notations, a line without arrows implies a bi-directional link or an undirected relationship. Consistency is key.
Understanding navigability helps in writing efficient code. If Object A does not need to access Object B, the link should not exist or should not be navigable. This reduces coupling.
📝 Summary of Key Takeaways
Object diagrams provide a concrete view of a system at a specific moment. They complement class diagrams by adding values and instances. By following best practices and avoiding common mistakes, teams can leverage this tool for better debugging, documentation, and design validation.
Focus on clarity. Use tables and lists to organize complex information. Ensure that every link has a purpose and every value is accurate. This discipline leads to more robust software architecture and fewer errors in production.
Start small. Model a single process. Expand as the system grows. The goal is not to document everything, but to document what is necessary for understanding and maintenance.