When documenting the static structure of a software system, the UML object diagram serves as a critical snapshot of reality. Unlike class diagrams that define the blueprint, object diagrams show the actual instances at a specific moment in time. Creating clear, readable, and accurate diagrams requires discipline and adherence to specific modeling standards. This guide outlines the essential strategies for constructing effective object diagrams that communicate system state without confusion.
🔍 Understanding the Purpose of an Object Diagram
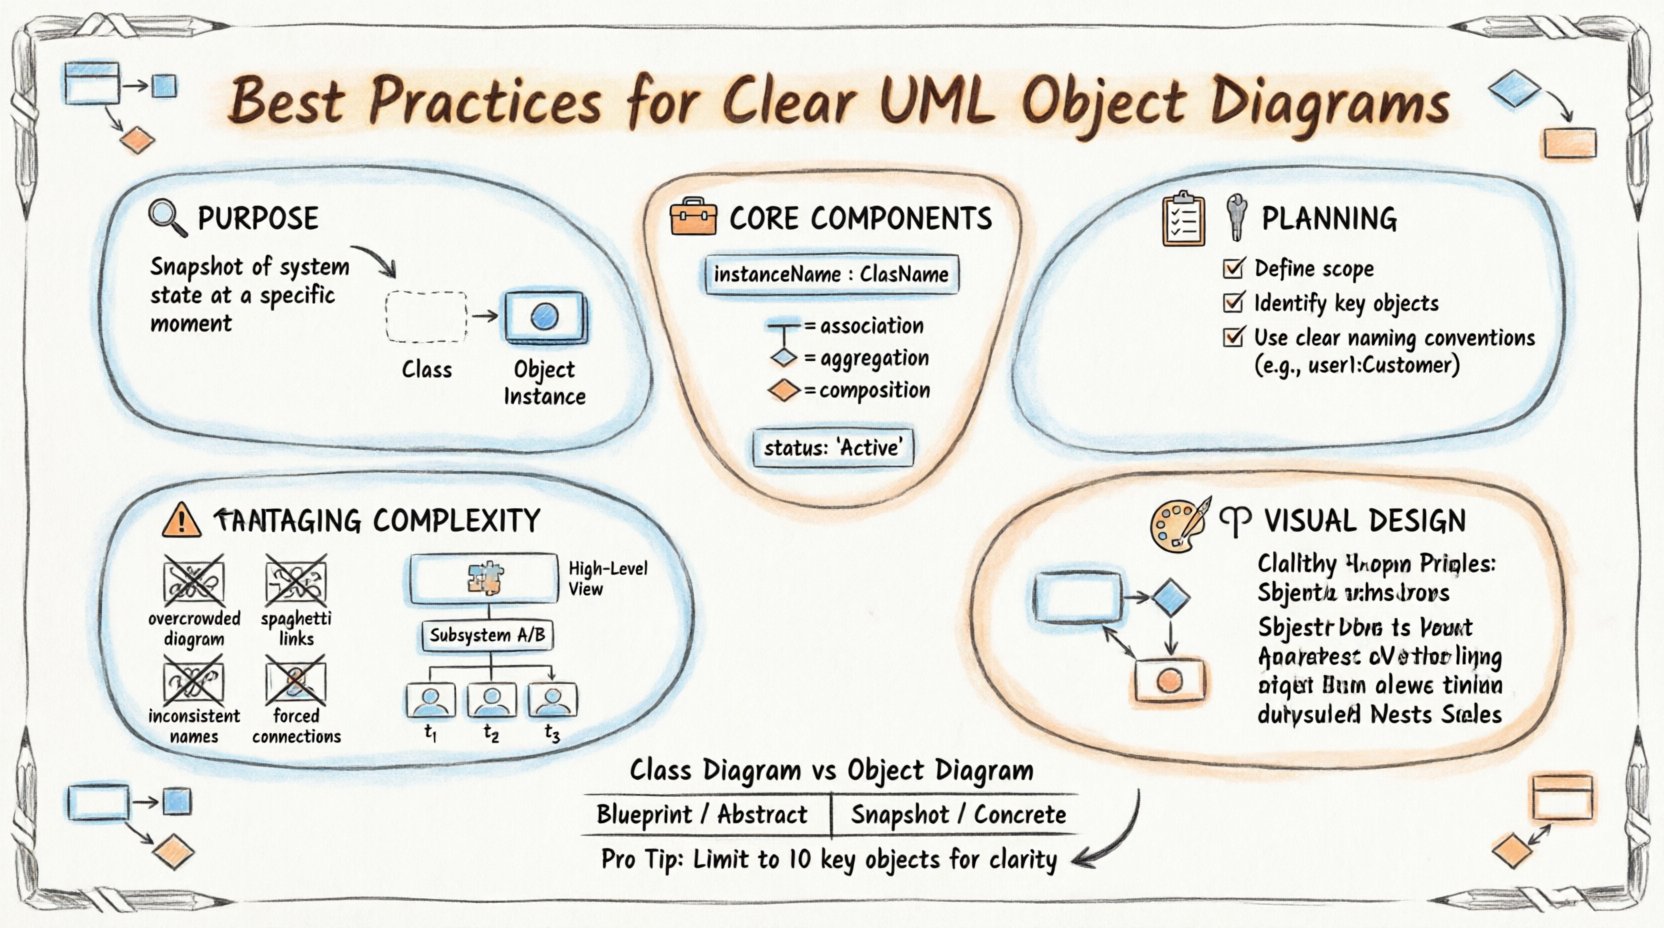
Before drawing a single box, it is vital to understand the function of the instance diagram. While class diagrams describe types and relationships, object diagrams describe the state of data and objects during execution. They are often used to:
- Validate the structure of a specific scenario or use case.
- Document the state of a system at a particular point in time.
- Clarify complex relationships that are hard to visualize in abstract class models.
- Aid in debugging by showing how instances interact.
Think of this diagram as a photograph of the system’s data architecture. It captures the concrete reality, whereas the class diagram captures the theoretical design. Clear diagrams help stakeholders understand how data flows through specific objects and how they link to one another.
🛠️ Core Components and Semantics
To design a professional diagram, you must adhere to the standard notation. Deviating from these norms creates ambiguity. The following elements form the foundation of any object diagram.
1. Object Instances
Objects represent specific instances of a class. They are depicted as rectangles with the object name underlined. The name usually follows the pattern:
- instanceName : ClassName
For example, user1 : Customer or cart55 : ShoppingCart. The class name should always be present after the colon. Omitting the class name makes the diagram difficult to interpret, especially if multiple objects of the same type exist.
2. Links and Relationships
Links represent the associations between instances. They are lines connecting objects. Unlike class diagrams, object diagrams do not typically show multiplicity on the lines themselves, but rather the specific connections that exist at that moment. However, indicating the type of link is crucial.
- Association: A standard connection between two objects.
- Aggregation: A whole-part relationship where the part can exist independently.
- Composition: A strong whole-part relationship where the part cannot exist without the whole.
- Generalization: Inheritance relationships between specific instances (rare but possible).
3. Attributes and State
Sometimes, diagrams include the current values of attributes to show specific state. This is useful for illustrating a specific test case or bug report.
name: "Alice"status: "Active"balance: 50.00
Use attributes sparingly. Too much data clutter makes the diagram unreadable. Only include values that are relevant to the specific scenario you are illustrating.
📝 Pre-Design Planning
Jumping straight into drawing often leads to messy results. A structured planning phase ensures the final diagram is logical and concise.
Define the Scope
What is the goal of this diagram? Are you showing:
- A user session?
- A database transaction state?
- The initialization of a system?
Limit the scope to a manageable number of objects. If a system has thousands of objects, an object diagram should focus on a specific subset. A diagram with 50 objects is often harder to read than one with 10 well-explained objects.
Identify Key Actors and Objects
Not every object in the system needs to appear. Select the objects that are central to the scenario. Ask yourself:
- Which objects are active in this moment?
- Which objects hold the data being discussed?
- Which objects are the entry points for this interaction?
Establish Naming Conventions
Consistency is key for readability. Adopt a strict naming standard before you begin.
- Prefixes: Use prefixes for specific types (e.g.,
c_for customer,o_for order). - Uniqueness: Ensure every instance name is unique within the diagram to avoid confusion.
- Clarity: Avoid generic names like
obj1ortest. Use names that reflect the role, such aspendingOrderormainController.
🎨 Visual Design Principles
Visual clarity is just as important as semantic accuracy. A well-designed diagram reduces cognitive load for the reader.
1. Layout and Alignment
Arrange objects logically. Do not scatter them randomly across the canvas. Use the following techniques:
- Grouping: Cluster related objects together. If a
CustomerandAddressare linked, place them near each other. - Flow Direction: Arrange objects to reflect the flow of data or control (e.g., left to right or top to bottom).
- Spacing: Maintain consistent gaps between boxes. Uneven spacing looks unprofessional and makes scanning difficult.
2. Managing Link Crossings
Crossing lines create visual noise. Try to minimize them.
- Use orthogonal lines (horizontal and vertical segments) instead of diagonal lines where possible.
- If lines must cross, avoid placing a third object at the intersection point, as this looks like a connection.
- Consider using curved lines sparingly to route around clusters of objects.
3. Color and Formatting
While color is not part of the standard UML specification, using distinct visual cues can help in digital modeling environments. However, since black and white is the standard for documentation, rely on line styles.
- Solid Lines: Standard associations.
- Dashed Lines: Dependencies or realization.
- Open Diamonds: Aggregation.
- Filled Diamonds: Composition.
Ensure all text is legible. Avoid small font sizes. If the diagram is too large for one page, use multiple pages or zoom levels rather than shrinking text.
📊 Object Diagram vs. Class Diagram
Confusion often arises between these two diagram types. A comparison table helps clarify their distinct roles.
| Feature | Class Diagram | Object Diagram |
|---|---|---|
| Focus | Abstract structure and types | Concrete instances and state |
| Time | Static (Blueprint) | Snapshot (Specific moment) |
| Names | Class names only | Instance name : Class name |
| Multiplicity | Shows potential relationships (e.g., 1..*) | Shows actual existing links |
| Usage | Design phase, architecture | Testing, debugging, documentation |
Understanding this distinction prevents the common error of trying to show dynamic behavior in a static object diagram.
⚠️ Common Pitfalls to Avoid
Even experienced modelers make mistakes. Being aware of common errors helps you produce cleaner diagrams.
1. Overcrowding
Attempting to show the entire system in one diagram is a frequent mistake. Object diagrams are meant to be granular. If a diagram feels cluttered:
- Split it into multiple diagrams focusing on different subsystems.
- Remove objects that are not directly involved in the current context.
- Hide internal attributes that are not relevant to the relationship.
2. Ambiguous Links
Do not draw a line between two objects without a clear meaning. Every link should represent a valid association. If two objects are connected, there must be a code path or a logical reason for that connection.
- Avoid “spaghetti code” visuals where lines crisscross everywhere.
- Label links if the relationship has a specific role (e.g.,
owns,manages).
3. Inconsistent Naming
Using different names for the same object type causes confusion. If you have a class Product, ensure all instances are clearly identified as products, perhaps using a prefix like prod_.
4. Ignoring Null States
Not every relationship exists at every moment. An object might exist without a link to another object. Do not force connections just to make the diagram look “complete”. Represent the actual state, even if it means an object is isolated.
🔄 Managing Complexity and Scale
As systems grow, object diagrams can become unwieldy. Here are strategies for handling complexity.
1. Abstraction Levels
Create diagrams at different levels of detail.
- High-Level: Shows major components and their primary links.
- Low-Level: Shows specific attributes and detailed instance relationships.
This allows stakeholders to choose the level of detail they need without being overwhelmed.
2. Subsystem Decomposition
Break large diagrams into subsystems. You might have a diagram for the Order Processing subsystem and another for the Inventory Management subsystem. Link them conceptually, but keep the diagrams separate to maintain focus.
3. Dynamic State Indication
Object diagrams are static snapshots. If you need to show change over time, use a series of object diagrams rather than one complex diagram. Sequence them to show the progression of state.
- State 1: Object created.
- State 2: Object linked to others.
- State 3: Object updated or deleted.
📖 Documentation and Maintenance
An object diagram is a living document. It requires maintenance to remain useful.
1. Keeping Diagrams Current
When the system code changes, the diagram should ideally reflect that change. Outdated diagrams can mislead developers and testers. Establish a review process where diagrams are checked during code reviews.
2. Cross-Referencing
Link your object diagrams to class diagrams and sequence diagrams. This provides context. If a reader sees a link in the object diagram, they should be able to find the definition in the class diagram.
3. Version Control
Store diagrams in a version control system along with your codebase. This ensures that the documentation evolves with the product. Include metadata about when the diagram was created and by whom.
🏗️ Practical Example: E-Commerce Scenario
To illustrate these principles, consider an e-commerce scenario. We want to document the state of a shopping cart during checkout.
Key Objects
cart : ShoppingCartitem1 : Productitem2 : Productuser : Customerpayment : CreditCard
Key Relationships
cartcontainsitem1anditem2(Composition).cartbelongs touser(Association).userusespayment(Association).
Visual Arrangement
Place user on the left. Place cart in the center. Place items on the right. Place payment below the cart. This creates a logical flow from user to cart to items to payment.
Attribute State
Show specific values to make it clear:
item1 : Product { name: "Laptop", price: 1000 }cart : ShoppingCart { total: 1000, status: "Pending" }
This specific detail helps validate that the total price calculation is correct at this state.
🚀 Final Thoughts on Modeling Accuracy
Designing clear UML object diagrams is a balance between technical precision and visual communication. The goal is not just to represent data, but to make that data understandable to humans. By following strict naming conventions, limiting scope, and avoiding visual clutter, you create artifacts that add genuine value to the development lifecycle.
Remember that the diagram is a tool for thinking, not just a record of code. It helps you visualize problems before they occur. Take the time to plan, review, and refine your diagrams. A well-crafted object diagram reduces ambiguity, speeds up debugging, and ensures that everyone on the team has a shared understanding of the system’s current state.
Apply these practices consistently. Over time, your diagrams will become more intuitive and your documentation more robust. This discipline pays off when onboarding new developers or troubleshooting complex system behaviors.