


In the intricate world of embedded systems, reliability is not just a feature; it is a requirement. When software manages hardware resources, the stakes involve physical operations, safety mechanisms, and real-time responsiveness. One of the most insidious challenges in this domain is the deadlock. A deadlock occurs when two or more processes are unable to proceed because each is waiting for the other to release a resource. This state of permanent blocking can halt an entire system, leading to critical failures.
To mitigate this risk, engineers rely on timing diagrams. These visual representations map out the execution of tasks over time, revealing interactions that standard code reviews often miss. By analyzing the temporal relationship between tasks, developers can identify resource contention before it becomes a fatal error. This guide explores the technical mechanics of how timing diagrams function as a primary tool for deadlock prevention in embedded environments.
Understanding Deadlock Mechanisms in Embedded Contexts 🧩
Before applying a solution, one must understand the problem. Deadlocks are not random occurrences; they follow specific logical conditions. In embedded software, these conditions are often triggered by the interaction between Interrupt Service Routines (ISRs), background tasks, and hardware drivers.
The Four Necessary Conditions
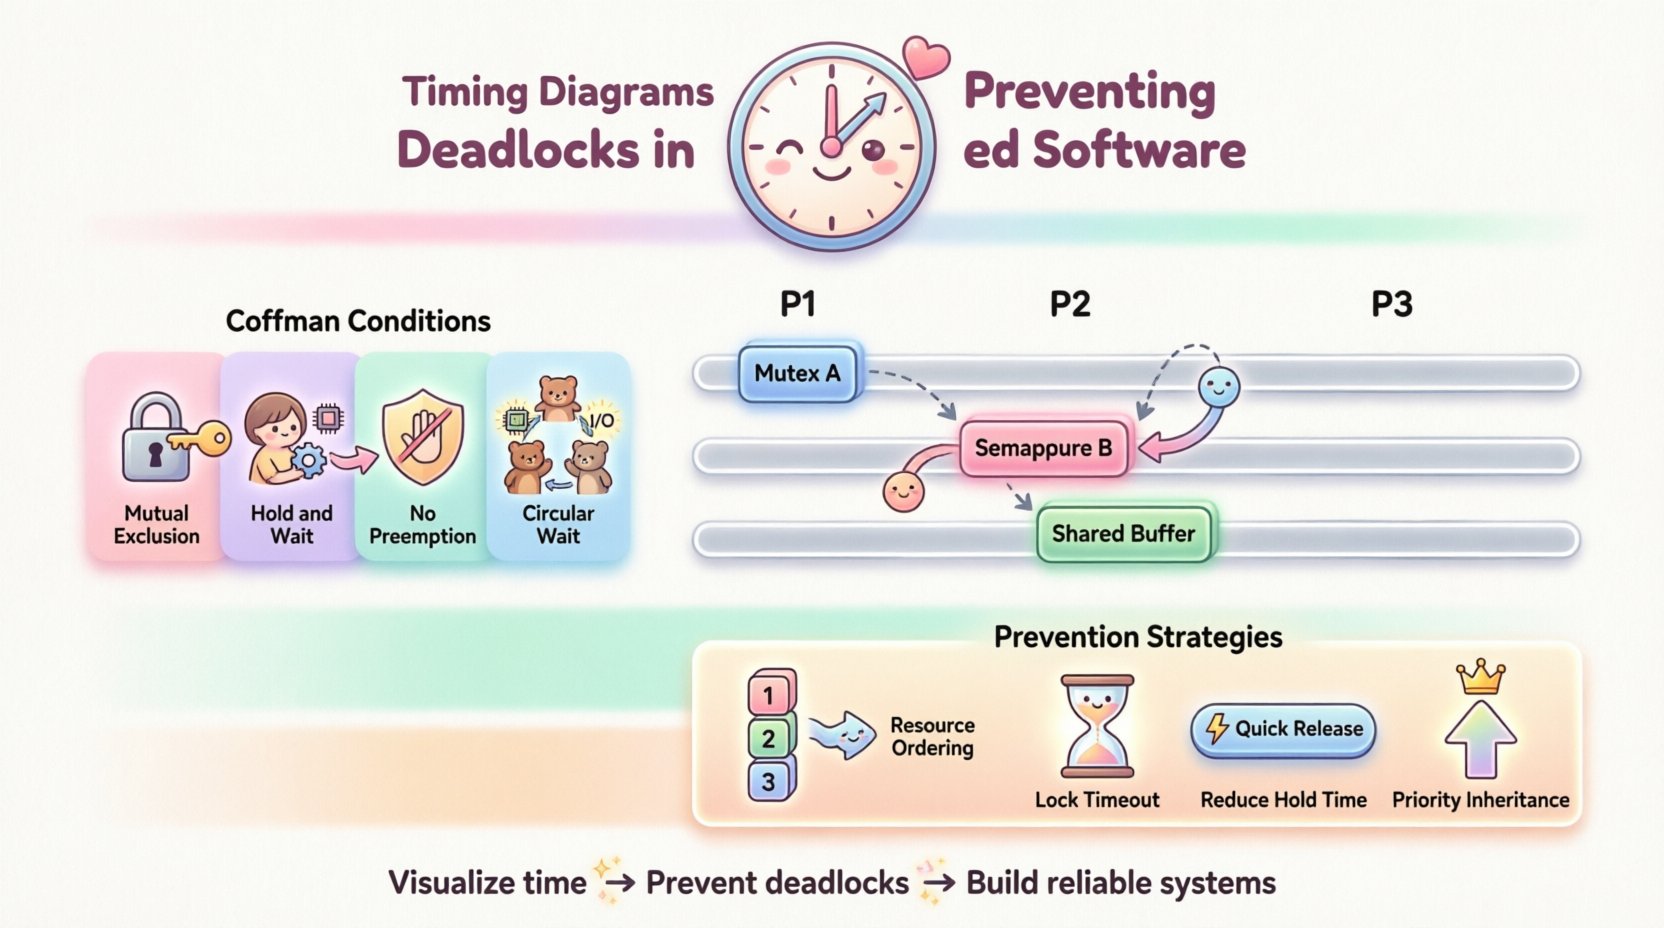
For a deadlock to occur, four conditions must hold true simultaneously. These are often referred to as the Coffman conditions:
- Mutual Exclusion: A resource cannot be shared; only one task can use it at a time.
- Hold and Wait: A task holds at least one resource while waiting to acquire additional resources held by others.
- No Preemption: Resources cannot be forcibly taken from a task; they must be released voluntarily.
- Circular Wait: A set of tasks exists such that each task is waiting for a resource held by the next task in the chain.
Removing any one of these conditions prevents deadlock. Timing diagrams assist primarily in identifying the Circular Wait and Hold and Wait scenarios by visualizing the timeline of resource acquisition and release.
Why Embedded Systems Are Vulnerable ⚙️
Unlike general-purpose computing, embedded systems often operate with limited resources and strict timing constraints. The following factors increase vulnerability:
- Shared Hardware Peripherals: Multiple tasks may need access to a single SPI bus or GPIO pin.
- Prioritization Inversion: High-priority tasks may wait for low-priority tasks holding necessary locks.
- Non-Deterministic Delays: Interrupts can interrupt task execution at unpredictable moments, altering the flow of resource locking.
Without a visual tool to track these interactions, logical errors in resource management can remain hidden until the system is deployed.
Defining Timing Diagrams in Software Analysis 📊
A timing diagram is a graphical representation that shows the behavior of two or more parallel processes over time. It plots events along a horizontal axis representing time and uses vertical lines to indicate the duration of specific states.
Key Components of a Timing Diagram
When constructing a timing diagram for embedded software, specific elements must be defined clearly:
- Process Lines: Horizontal tracks representing individual tasks, threads, or interrupts.
- Resource Blocks: Segments on the line indicating when a task holds a lock or resource.
- Wait States: Gaps or specific markers showing when a task is suspended pending an event.
- Interactions: Arrows or lines connecting different process tracks to show communication or data transfer.
Unlike a flowchart, which shows logical flow, a timing diagram shows when things happen. This temporal dimension is critical for detecting concurrency issues.
Visualizing Concurrency with Timing ⏱️
Concurrency introduces complexity because the order of events is not always fixed. A timing diagram captures the worst-case scenarios. By layering the execution of tasks, engineers can see overlaps that indicate contention.
| Diagram Element | Representation | Significance for Deadlock |
|---|---|---|
| Locked Resource | Shaded Block on Timeline | Shows duration of ownership; long blocks increase contention risk. |
| Waiting Task | Flat Line or Pause | Indicates a task is blocked; duration shows potential delay. |
| Resource Request | Vertical Arrow | Shows the moment a lock is attempted; overlaps indicate conflict. |
| Release Event | End of Shaded Block | Signals availability for other tasks. |
Detecting Potential Deadlocks Through Visualization 🔍
The primary utility of a timing diagram lies in its ability to expose circular dependencies. When Task A waits for Task B, and Task B waits for Task A, the diagram will show a specific pattern of blocking lines that never resolve.
Identifying Circular Wait Patterns
In a valid system, resource acquisition chains should eventually terminate. In a deadlock scenario, the diagram reveals a loop. For example:
- Task 1 acquires Resource X.
- Task 1 attempts to acquire Resource Y.
- Task 2 holds Resource Y.
- Task 2 attempts to acquire Resource X.
On a timing diagram, this appears as Task 1’s timeline extending past Task 2’s release of Resource Y, while Task 2’s timeline extends past Task 1’s release of Resource X. The overlapping wait states create a visual “cross” that signifies a deadlock.
Spotting Priority Inversion
Priority inversion occurs when a low-priority task holds a resource needed by a high-priority task, while a medium-priority task preempts the low-priority one. This creates a situation where the high-priority task waits indefinitely.
A timing diagram highlights this through the ordering of execution blocks. You will see a medium-priority task running while a high-priority task is blocked waiting for a low-priority task. This inversion is often invisible in code but glaringly obvious on a timeline.
Analyzing Jitter and Latency
Deadlocks are not the only timing issue. Excessive jitter (variation in time) or latency (delay) can also cause system failures. Timing diagrams help set bounds. If a resource is held longer than the maximum allowable execution time (WCET – Worst Case Execution Time), the system may miss deadlines.
- WCET Analysis: The diagram helps estimate the maximum time a task holds a resource.
- Deadline Verification: Ensures that waiting tasks are unblocked before their deadlines expire.
Strategies for Prevention Using Timing Analysis 🛠️
Once a potential deadlock is identified on a timing diagram, specific architectural changes can be implemented to prevent it. The visual data guides these decisions.
1. Resource Ordering Protocols
One of the most effective methods to prevent circular waits is to enforce a global order on resource acquisition. If every task requests resources in the same order (e.g., Resource A before Resource B), a circular wait becomes mathematically impossible.
How the Diagram Helps: By plotting the acquisition order, engineers can verify that no task acquires a lower-numbered resource after acquiring a higher-numbered one. The diagram makes violations of this order immediately visible.
2. Lock Timeout Mechanisms
Implementing timeouts ensures that a task does not wait indefinitely. If a lock cannot be acquired within a specified time, the task aborts or retries.
Visual Check: On the timing diagram, this appears as a maximum duration line for the wait state. If the wait block exceeds this line, the system knows a recovery mechanism must trigger.
3. Reducing Hold Time
The longer a resource is held, the higher the probability of contention. Tasks should release locks as quickly as possible.
Optimization: Timing diagrams help identify sections of code where resources are held unnecessarily long. Engineers can refactor code to perform calculations outside the critical section (after acquiring the lock) or split large critical sections into smaller ones.
4. Priority Inheritance
To prevent priority inversion, protocols like Priority Inheritance temporarily raise the priority of the low-priority task holding the resource to match the highest-priority task waiting for it.
Diagram Impact: This changes the execution block heights in the diagram. The low-priority task’s block becomes longer (due to higher priority) but completes faster because it is not preempted by medium-priority tasks.
Common Scenarios and Solutions 💡
Real-world embedded systems face specific patterns of concurrency. Below are common scenarios where timing diagrams provide clarity.
Scenario A: The Interrupt Handler Lock
ISRs often use locks to protect shared data structures. If an ISR holds a lock while waiting for a hardware event, and a task also waits for that ISR to complete, a deadlock occurs.
| Issue | Timing Diagram Clue | Solution |
|---|---|---|
| ISR Blocking | ISR line overlaps with Task line in wait state | Disable interrupts during critical sections or use software queues. |
| Shared Data | Multiple overlapping write blocks | Use atomic operations or separate buffers. |
Scenario B: The Dining Philosophers Problem
This classic problem involves multiple tasks competing for shared resources (forks). If every task picks up one fork and waits for the second, everyone waits forever.
Diagram Visualization: You will see parallel “pickup” bars for all tasks, followed by parallel “wait” bars. The diagram shows the system stalling completely.
Prevention: Limit the number of tasks that can hold resources simultaneously. The timing diagram helps calculate the maximum concurrency level before resource exhaustion occurs.
Scenario C: Asynchronous Communication
When tasks communicate via messages rather than shared memory, deadlocks can still occur if the sender waits for a receiver that is blocked.
Analysis: Timing diagrams show the gap between the send event and the receive event. If the receiver is blocked waiting for a lock, the sender’s send block extends indefinitely.
Integrating Timing Analysis into Development ⚙️
Timing analysis should not be an afterthought. It must be integrated into the design phase to be effective.
1. Pre-Implementation Modeling
Before writing code, create a timing model of the system architecture. Define the tasks, their priorities, and the resources they need. Simulate the timeline to check for conflicts. This catches logical errors early.
2. Runtime Monitoring
Some systems include runtime monitors that record timing data during operation. This data can be exported to generate actual timing diagrams. Comparing the actual diagram with the predicted model reveals discrepancies caused by hardware variations or unexpected loads.
3. Stress Testing
Run the system under maximum load conditions. Deadlocks often only appear when all resources are contested simultaneously. Timing diagrams generated from stress tests are the most valuable for validation.
Best Practices for Effective Timing Diagrams 📝
To get the most out of timing diagrams, adhere to these guidelines:
- Granularity: Do not make the diagram too coarse. Individual instructions or small blocks may be necessary to see lock contention.
- Consistency: Use consistent symbols for locks, waits, and interrupts across all diagrams in the project.
- Scope: Focus on the critical paths. Do not diagram every function; focus on resource-heavy modules.
- Documentation: Annotate the diagrams. Mark specific lines as “Critical” or “Resource Bound” to guide future maintenance.
- Collaboration: Share diagrams with hardware and software teams. Hardware engineers can clarify interrupt latencies; software engineers can clarify task logic.
Challenges and Limitations ⚠️
While powerful, timing diagrams are not a silver bullet. Engineers must understand their limitations.
- State Explosion: In complex systems, the number of possible timing permutations can be too large to visualize completely.
- Abstraction: Diagrams abstract away hardware details. Actual execution times may vary due to cache misses or bus arbitration.
- Human Error: Drawing a timing diagram requires expertise. Incorrect assumptions about task behavior lead to incorrect diagrams.
Despite these challenges, the visual clarity provided by timing diagrams remains unmatched for concurrency analysis. They force the engineer to think temporally, not just logically.
Final Considerations for System Safety ✅
Deadlock prevention is a cornerstone of safety-critical embedded systems. Whether designing for automotive braking, medical devices, or industrial automation, the cost of a deadlock is high. Timing diagrams provide the lens through which these invisible hazards become visible.
By rigorously applying timing analysis, teams can ensure that resource allocation is fair, predictable, and robust. This approach reduces the risk of system hangs and enhances overall reliability. As embedded systems become more complex with more cores and more concurrent tasks, the role of visual timing analysis will only grow in importance.
Investing time in creating and analyzing these diagrams pays dividends in stability. It shifts the focus from reacting to failures to preventing them through design. For any engineer working with real-time constraints, mastering the art of the timing diagram is a fundamental requirement for building trustworthy software.