In the intricate landscape of software architecture, clarity is paramount. When systems grow in complexity, the static structure defined by classes often becomes insufficient to capture the specific runtime reality. This is where the UML object diagram steps in. It serves as a snapshot of a system at a particular moment, revealing the concrete instances of classes and how they interact. Unlike class diagrams that define blueprints, object diagrams depict the actual building materials in place.
For developers, architects, and technical stakeholders, understanding these diagrams is crucial for debugging, documentation, and communication. This guide provides a thorough examination of what constitutes an object diagram, how to read them, and when to apply them within the development lifecycle.
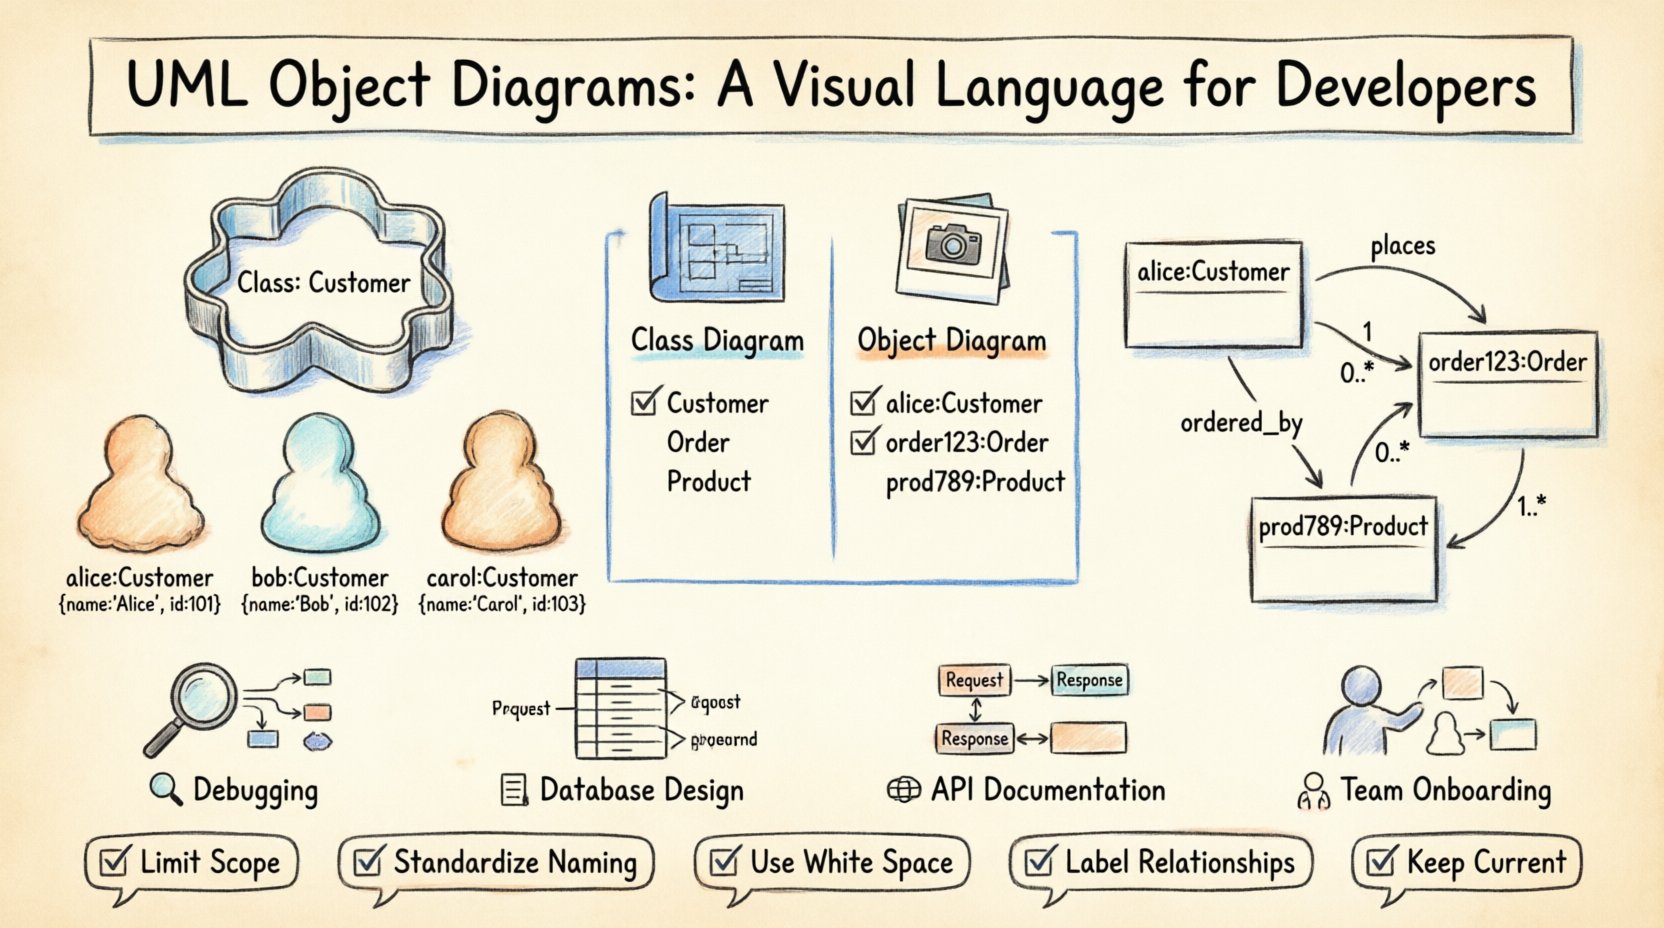
🔍 Understanding the Snapshot of State
An object diagram is a specialized type of static structure diagram in the Unified Modeling Language (UML). It focuses on the specific instances of classes existing at a specific point in time. While a class diagram describes the potential for behavior and structure, an object diagram describes the actual state of a running system or a specific design scenario.
Think of a class as a cookie cutter and the object diagram as the cookies themselves. The cutter defines the shape, but the cookies represent the actual data. This distinction is vital when dealing with:
- Runtime debugging: Visualizing the actual data flow when a bug occurs.
- Database design: Mapping specific records and their relationships.
- API documentation: Showing expected input and output structures.
- System analysis: Understanding the complexity of relationships in a specific context.
Because these diagrams represent a static snapshot, they do not show time-based behavior or sequence. They freeze the moment. This limitation is also their strength, as it allows developers to analyze a complex state without the noise of temporal changes.
🏗️ Class vs. Object: The Distinction
Confusion often arises between class diagrams and object diagrams. While they share many notational elements, their purpose and content differ significantly. Understanding this difference is the first step toward effective modeling.
| Feature | Class Diagram | Object Diagram |
|---|---|---|
| Focus | Definition of types | Specific instances (objects) |
| Notation | Class Name | Object Name: Class Name |
| Scope | General, reusable logic | Specific scenario or snapshot |
| Attributes | Type definitions (e.g., String) | Actual values (e.g., “John”) |
| Use Case | High-level design, schema | Testing, debugging, data analysis |
The notation for an object instance typically includes the object name followed by a colon and the class name. For example, User:Customer indicates an instance named User of the class Customer. This explicit labeling helps distinguish between different instances of the same class within the same diagram.
🧩 Core Elements of an Object Diagram
To construct or interpret an object diagram accurately, one must understand its fundamental building blocks. These elements convey the structure and relationships of the system at a glance.
1. Objects
Objects are the primary entities in the diagram. They represent instances of a class. Visually, they appear as rectangles containing:
- Instance Name: The specific identifier for the object (e.g.,
order1). - Class Name: The type of object (e.g.,
Order). - Attribute Values: The specific data stored within the object at that moment.
2. Links
Links represent associations between objects. While class diagrams use lines to represent associations between classes, object diagrams use links to connect specific instances. A link is essentially a realization of an association.
- Solid Lines: Indicate a standard link between objects.
- Dashed Lines: Sometimes used to indicate derived relationships or weak associations.
- Arrowheads: Show the direction of the relationship (navigation).
3. Multiplicity
Multiplicity defines how many instances of one class relate to instances of another. In an object diagram, this is often implicit based on the number of links drawn, but it can be explicitly labeled on the link itself. Common multiplicities include:
- 1: Exactly one instance.
- 0..1: Zero or one instance.
- 1..*: One or more instances.
- 0..*: Zero or more instances.
4. Role Names
When two objects are linked, the link often has a role name. This clarifies the perspective of the relationship. For example, in a link between a Customer and an Order, the role from the customer’s perspective might be places, while from the order’s perspective, it might be ordered_by.
📐 Reading the Diagram: Syntax Rules
Consistency in notation is key to ensuring that diagrams are universally understood by the team. Adhering to standard syntax rules prevents ambiguity.
- Object Naming: An instance name should be unique within the diagram. It is common practice to use lowercase for the instance name and TitleCase for the class name, separated by a colon.
- Attribute Display: Attributes are listed below the class name within the object box. They show the current state. If an attribute has no value, it is often left blank or marked with
null. - Link Labels: Labels on links should be concise. They describe the relationship (e.g., “has”, “owns”, “contains”).
- Subclasses: If an object belongs to a subclass, it may be represented with a specific notation indicating inheritance, though often the superclass name is sufficient for clarity.
Consider the following textual representation of a simple object diagram structure:
customerA:Customername: "Alice"id: 101
orderX:Ordertotal: 150.00status: "Paid"
- Link:
customerAplacesorderX
🛠️ Practical Applications in Software Development
Object diagrams are not merely academic exercises. They have tangible applications in the daily workflow of software engineering teams.
1. Debugging Complex Data Flows
When a bug arises involving data corruption or unexpected null values, a class diagram rarely helps. An object diagram allows developers to trace the exact state of the data. By mapping the objects involved in the error, the root cause becomes visible.
2. Database Schema Verification
Before deploying a database migration, teams can use object diagrams to visualize how data will be linked. This helps identify potential integrity issues, such as orphaned records or circular dependencies, before they occur in production.
3. API Contract Design
When designing a REST API, the request and response bodies are essentially object states. Object diagrams can serve as visual documentation for these structures, making it easier for frontend developers to understand the expected payload.
4. Onboarding New Team Members
For new developers, understanding the runtime state of a legacy system can be daunting. Object diagrams provide a simplified view of how core entities interact in practice, bridging the gap between theory and reality.
📝 Creating Effective Object Diagrams
Creating a useful diagram requires discipline. A cluttered diagram defeats the purpose of visualization. Follow these guidelines to ensure clarity.
- Limit Scope: Do not attempt to diagram the entire system at once. Focus on a specific feature or module. A diagram showing the entire application state is often unreadable.
- Standardize Naming: Ensure all instance names follow the project’s naming conventions. Consistency reduces cognitive load.
- Use White Space: Arrange objects to minimize crossing lines. If lines must cross, use a small gap or node to indicate it is not a connection.
- Label Relationships: Never leave a link unlabeled if there is more than one type of relationship possible. Ambiguity leads to errors.
- Keep it Current: Object diagrams can become outdated quickly. Treat them as living documents that should be updated alongside code changes.
🚧 Common Pitfalls to Avoid
Even experienced modelers can fall into traps that reduce the utility of their diagrams. Awareness of these common mistakes helps maintain quality.
- Over-specification: Including every single attribute can make the diagram too dense. Include only the attributes relevant to the specific context or question being answered.
- Ignoring Nullability: Failing to show that an object might not exist (e.g., a user without a profile) can lead to incorrect assumptions about data availability.
- Mixing Concepts: Do not mix dynamic elements (like sequences or state changes) into a static object diagram. Keep the focus on structure.
- Ignoring Inheritance: If an object inherits behavior, the diagram should reflect the hierarchy. Hiding inheritance can obscure the true nature of the object’s capabilities.
🔄 Integration with Other UML Models
An object diagram does not exist in isolation. It works best when integrated with other parts of the UML suite. Understanding these connections enhances the overall modeling effort.
1. Sequence Diagrams
Sequence diagrams show the flow of messages over time. Object diagrams complement this by showing the objects that exist when those messages are sent. They answer the “Who is involved?” question, while sequence diagrams answer “What happens?”
2. Class Diagrams
The class diagram is the foundation. The object diagram is derived from it. If the class diagram changes, the object diagram must be reviewed to ensure the instances still align with the new definitions.
3. State Machine Diagrams
State diagrams describe how an object changes state. Object diagrams show the state at a specific point. Combining them helps in understanding the lifecycle of an instance.
🔎 Deep Dive: Multiplicity and Cardinality
Multiplicity is one of the most technical aspects of object modeling. It dictates the constraints on relationships. In an object diagram, this is visualized by the number of links connected to an object.
For example, consider a Library system.
- A
Bookobject can be associated with multipleCopyobjects. - A
Copyobject is associated with exactly oneBookobject.
If the diagram shows three Copy objects linked to one Book object, it visually confirms the multiplicity. If it shows a Copy linked to two Book objects, it violates the constraint unless the model allows for multiple ownership.
Understanding these constraints helps in database normalization. It ensures that foreign keys are placed correctly and that referential integrity is maintained.
🔧 Maintenance and Evolution
Software evolves. Requirements change. Code refactors. Object diagrams must evolve with them. However, maintaining high-fidelity object diagrams for large systems is often impractical due to the effort required.
Instead of maintaining a diagram for the entire system, focus on:
- Critical Paths: Diagrams for the core business logic that is most prone to change or error.
- Complex Interfaces: Areas where multiple systems interact.
- New Features: Create diagrams for new features before implementation to validate the design.
Automated tools can sometimes generate object diagrams from code analysis. While these provide a baseline, they often lack the semantic context that a human modeler adds. Manual review is still necessary to ensure the diagram tells the right story.
💡 Conclusion on Visualization
The value of a UML object diagram lies in its ability to simplify complexity. By focusing on instances rather than types, developers gain insight into the actual data landscape. This perspective is essential for building robust, maintainable systems.
When used correctly, these diagrams become a shared language. They bridge the gap between technical implementation and business requirements. They allow a team to discuss data states without needing to run the code or inspect the database directly.
Adopting this visual language requires practice. Start with small subsystems. Focus on clarity over completeness. As the team becomes comfortable with the notation, the diagrams will naturally become more detailed and useful. The goal is not perfection, but communication. A diagram that is understood is better than a perfect diagram that is ignored.
By integrating object diagrams into the design and documentation process, teams can reduce ambiguity, improve code quality, and accelerate the development cycle. The investment in understanding and creating these models pays dividends in system stability and team alignment.