The Internet of Things (IoT) ecosystem is defined by complexity. It is not merely about connecting devices; it is about orchestrating interactions across heterogeneous networks, constrained hardware, and strict temporal requirements. For developers architecting embedded systems, choosing the right visualization tool is critical. Two of the most prevalent modeling techniques in the Unified Modeling Language (UML) are Sequence Diagrams and Timing Diagrams. While they often appear together in documentation, they serve distinct purposes. Understanding when to employ each can prevent architectural failures in latency-sensitive applications.
This guide explores the nuances of these two diagram types. It delves into their structural differences, application in IoT contexts, and the specific scenarios where timing precision outweighs logical flow.
Understanding Sequence Diagrams in Embedded Systems 📋
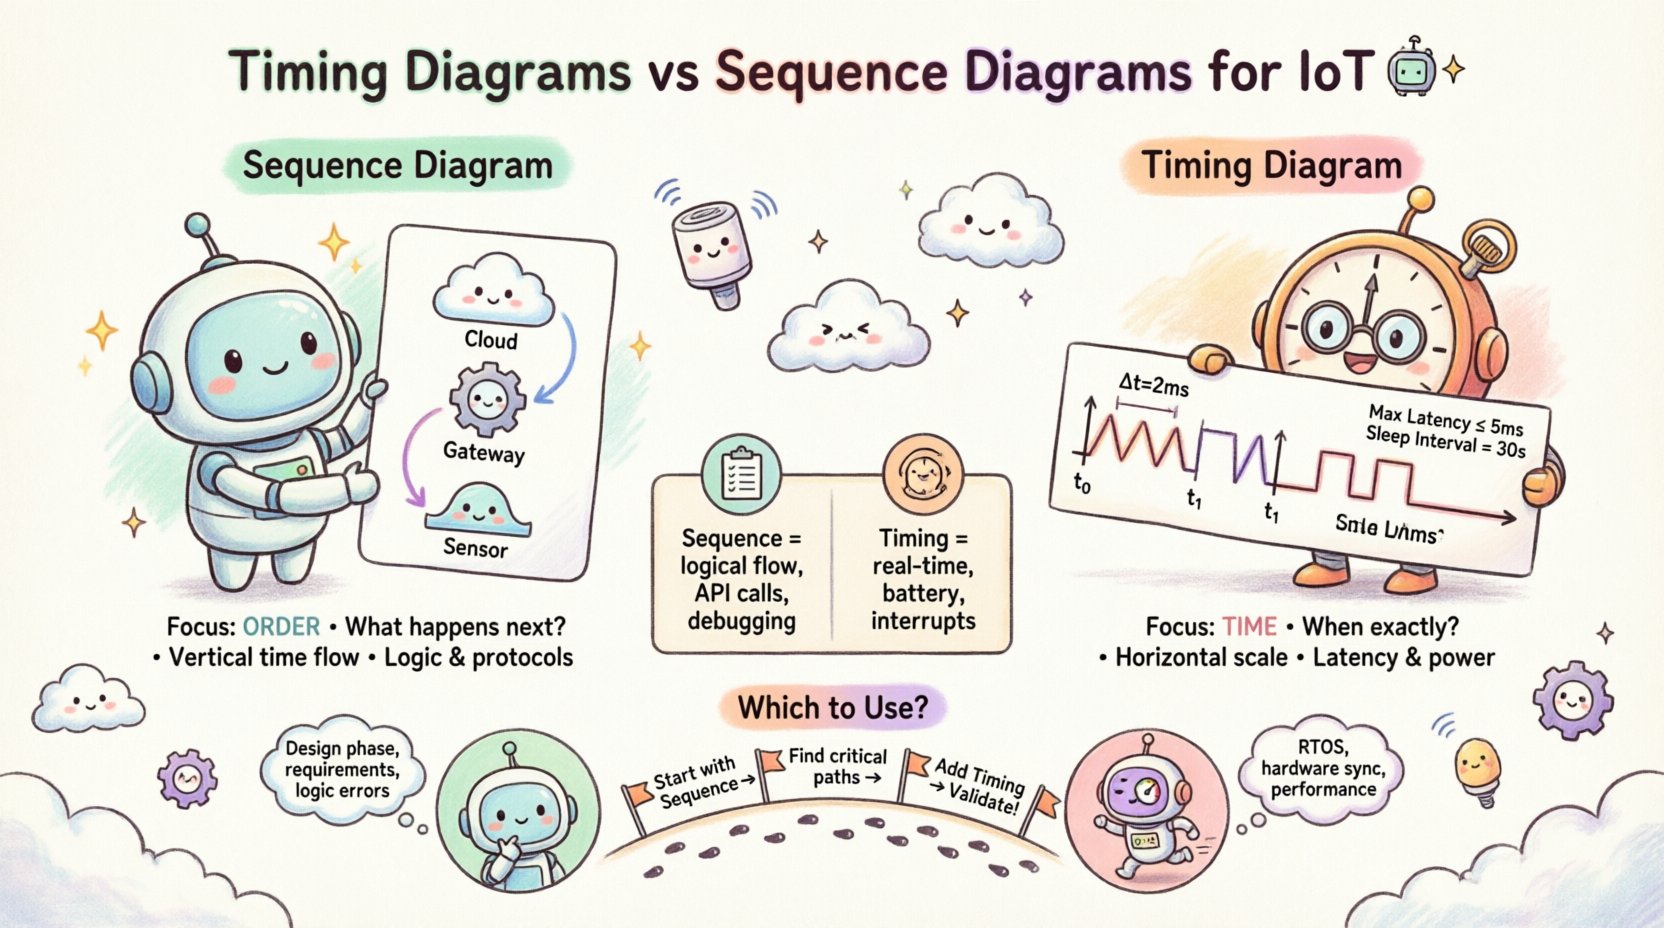
A Sequence Diagram is primarily concerned with the order of interactions. It maps out how objects, components, or subsystems communicate over time, but without strict temporal constraints. In an IoT context, this might represent a sensor sending data to a gateway, which then forwards it to a cloud server.
Core Characteristics
- Focus on Logic: It answers the question, “What happens next?” rather than “When exactly does it happen?”
- Vertical Time Axis: Time flows downwards, but the distance between messages does not necessarily correlate to real-world time units.
- Messages: Represented as arrows indicating request, response, or signal passing.
- Activation Bars: Show when an object is active or processing a task.
Typical IoT Use Cases
Sequence diagrams are ideal for documenting high-level protocol flows where the exact millisecond duration is less critical than the existence of a handshake.
- Authentication Handshakes: Verifying credentials between a device and a broker.
- State Transitions: Moving a device from “sleep” to “active” mode via a command signal.
- API Interactions: Defining the sequence of RESTful calls a firmware module makes to update configuration.
When modeling a device registration process, a sequence diagram ensures that the device sends its ID, receives a token, and then acknowledges receipt. If the order is wrong, the system fails. However, this diagram does not explicitly state that the token must be received within 50 milliseconds to remain valid.
The Role of Timing Diagrams in Real-Time Systems ⏱️
A Timing Diagram, often called a Timing Constraint Diagram, is specialized for scenarios where time is a critical variable. In IoT, where battery life, network latency, and sensor sampling rates dictate functionality, timing is often the difference between success and failure.
Core Characteristics
- Horizontal Time Axis: Time flows from left to right, allowing for precise measurement of intervals.
- State Changes: Focuses on the state of a lifeline (e.g., a pin state, a buffer content, or a thread status) over time.
- Constraints: Can define strict deadlines, such as “Response must occur within 10ms”.
- Events: Marks specific occurrences like an interrupt firing or a packet arriving.
Typical IoT Use Cases
Timing diagrams become essential when the architecture relies on hard real-time requirements or power management strategies.
- Interrupt Latency: Visualizing the time from a physical trigger (like a button press) to the CPU handling the interrupt service routine.
- Power Cycles: Mapping the time a device spends in sleep mode versus active transmission to calculate battery drain.
- Protocol Handshakes: Defining the timeout windows for CoAP or MQTT retransmissions.
- Synchronization: Ensuring multiple sensors sample data simultaneously for accurate aggregation.
Consider a temperature monitoring system. A sequence diagram shows that the sensor reads and sends data. A timing diagram shows that the read operation takes 5ms, the transmission takes 20ms, and the device must return to sleep before the 100ms window closes to save energy.
Side-by-Side Comparison 📊
To clarify the distinctions, we can examine the structural and functional differences between these two modeling techniques.
| Feature | Sequence Diagram | Timing Diagram |
|---|---|---|
| Primary Focus | Order of messages and logical flow | Time intervals and state changes |
| Time Representation | Abstract (vertical flow only) | Concrete (horizontal scale) |
| Key Question | What is the sequence of events? | How long does each event take? |
| IoT Application | Protocol logic, API calls | Latency, power consumption, interrupts |
| Complexity | High (many objects) | High (many time constraints) |
| Best For | Software architecture, logic verification | Firmware engineering, hardware integration |
Why Timing Matters in IoT Architecture 🌐
In general software development, a delay of a few seconds might be acceptable. In IoT, milliseconds can define the system’s viability. The physical world introduces variables that pure software logic diagrams often ignore.
1. Latency and Network Jitter
Wireless networks, such as Wi-Fi, LoRaWAN, or Zigbee, are subject to jitter. A sequence diagram might show a message sent and a reply received. A timing diagram allows you to model the variance. If the reply must arrive before the next sensor cycle begins, the timing diagram highlights if the network is reliable enough.
2. Battery Management
Power is the most constrained resource in many IoT nodes. Every millisecond a radio is active drains the battery. Timing diagrams allow engineers to calculate the duty cycle precisely. You can model the transition from “Deep Sleep” to “Radio On” to “Transmit” and back. This visualizes the exact energy cost of a specific interaction sequence.
3. Hardware Synchronization
When multiple sensors feed into a single microcontroller, data integrity depends on sampling rates. If one sensor samples at 100Hz and another at 10Hz, the timing diagram helps visualize how the microcontroller multiplexes these reads without dropping data.
When to Use Sequence Diagrams 🧠
While timing is crucial, the logical flow remains the backbone of system design. Sequence diagrams should be your primary tool during the initial design phase.
Requirements Analysis
Stakeholders often understand logical flows better than time intervals. Describing a workflow as “Device sends data -> Cloud validates -> Device acknowledges” is easier for a product manager to understand than a timeline of milliseconds.
Debugging Logic Errors
If a device fails to connect, a sequence diagram helps trace the path of failure. Did it send the request? Did the server respond? Did the device receive the response? It isolates the logical break.
Inter-Component Communication
In complex firmware, multiple threads or tasks run concurrently. A sequence diagram can show how Task A requests data from Task B. It clarifies dependencies without getting bogged down in the exact CPU cycles involved.
When to Use Timing Diagrams 🕒
Timing diagrams are the specialist tool. They are used when the logic is established, but the temporal constraints need validation.
Real-Time Operating Systems (RTOS)
When deploying on an RTOS, task priorities and preemption matter. A timing diagram can illustrate how a high-priority interrupt preempts a lower-priority background task. It shows the exact time the background task is paused.
Hardware Interface Verification
Driving hardware registers often requires specific timing. For example, an I2C transaction requires specific setup and hold times. A timing diagram is the standard way to document these electrical characteristics alongside the logical protocol.
Performance Bottleneck Identification
If the system is too slow, a timing diagram reveals where the delays occur. Is the processing taking too long? Is the network wait blocking the main thread? The horizontal axis makes these bottlenecks visually obvious.
Integrating Both for Robust Design 🏗️
Advanced IoT development rarely relies on just one. The most robust documentation combines both. A Sequence Diagram provides the map of the journey, while a Timing Diagram provides the speed limits and travel times.
Step-by-Step Integration
- Start with Sequence: Define the message flow between the device, gateway, and cloud.
- Identify Critical Paths: Mark which interactions have strict deadlines (e.g., safety alerts vs. telemetry logs).
- Apply Timing: For the critical paths, create a Timing Diagram to define the maximum allowable latency.
- Validate: Check if the timing constraints fit within the hardware capabilities.
Example Workflow: Safety Alert
Consider a fire detection sensor.
- Sequence: Sensor detects heat -> Sends Alert -> Gateway Forwards -> Cloud Notifies User.
- Timing: Detection to Alert transmission must be < 100ms. Network latency must be < 500ms. Total end-to-end time < 1 second.
If the sequence diagram is perfect but the timing diagram shows a 2-second delay, the system fails its requirement.
Common Pitfalls in Modeling 🚫
Even experienced engineers make mistakes when visualizing IoT systems. Awareness of these common errors helps maintain accuracy.
1. Confusing Logical with Physical Time
A sequence diagram implies time flows down. A developer might mistake the distance between messages for duration. Always label axes clearly. Use a timing diagram when duration is the variable.
2. Ignoring Asynchronous Behavior
IoT devices often operate asynchronously. Waiting for a network response might block the device. A sequence diagram might show a blocking call. A timing diagram reveals the idle time during this wait, which is critical for power analysis.
3. Over-Complexity
Trying to model every millisecond of a complex system leads to unreadable diagrams. Focus on the critical paths. A timing diagram for the entire system lifecycle is too large; focus on the communication burst.
4. Missing State Persistence
In IoT, state often persists across reboots. Diagrams should indicate if a message is lost and needs re-transmission. Timing diagrams can show the timeout window for retries.
Best Practices for Documentation 📝
To ensure these diagrams remain useful throughout the development lifecycle, adhere to these guidelines.
- Consistent Naming: Use the same names for lifelines in both diagram types to avoid confusion.
- Version Control: Treat diagrams as code. Store them in the same repository as the firmware.
- Update Regularly: If the protocol changes, update the sequence diagram. If the latency requirements change, update the timing diagram.
- Keep it Readable: Avoid cluttering the horizontal axis with too many lifelines. Split complex interactions into multiple diagrams.
- Use Standard Notation: Stick to UML standards so any developer can interpret the visual language.
Technical Considerations for Implementation 🔧
When translating these diagrams into actual code, several technical factors come into play.
1. Clock Synchronization
Timing diagrams assume a shared notion of time. In distributed IoT systems, clocks drift. NTP or GPS synchronization might be required. The diagram should reflect the synchronization mechanism if it impacts timing.
2. Interrupt Service Routines (ISR)
ISRs run outside the main loop. A timing diagram is the best way to document ISR latency. It shows how long the main program is paused while the ISR executes.
3. Buffer Management
Data arrives in packets. If a buffer fills up before it is processed, data is lost. Timing diagrams can visualize the buffer fill rate versus the processing rate.
Conclusion 🏁
Selecting between a Sequence Diagram and a Timing Diagram depends on the specific needs of your IoT project. Sequence diagrams excel at defining the logical order of operations, ensuring that the right messages are sent in the right order. Timing diagrams excel at defining the temporal constraints, ensuring that the system meets latency and power requirements.
For a robust architecture, do not choose one over the other. Use Sequence Diagrams to map the journey and Timing Diagrams to measure the speed. This dual approach provides a comprehensive view of system behavior, reducing the risk of integration issues in the field.
By applying these modeling techniques with precision, IoT developers can build systems that are not only logically sound but also performant within the physical constraints of the real world.