


Software architecture relies heavily on visual abstraction. While many teams default to Class Diagrams for structure, there is a specific scenario where a different view becomes critical. The UML Object Diagram serves as a snapshot of the system at a specific moment in time. It depicts instances of classes, the links between them, and the actual data values flowing through the architecture. Understanding when to deploy this tool is essential for maintaining clarity without overwhelming complexity.
This guide provides a comprehensive look at the utility, components, and decision criteria for using Object Diagrams. We will explore the technical distinctions, practical applications, and the specific moments where this diagram type offers the highest return on investment for your documentation and design efforts.
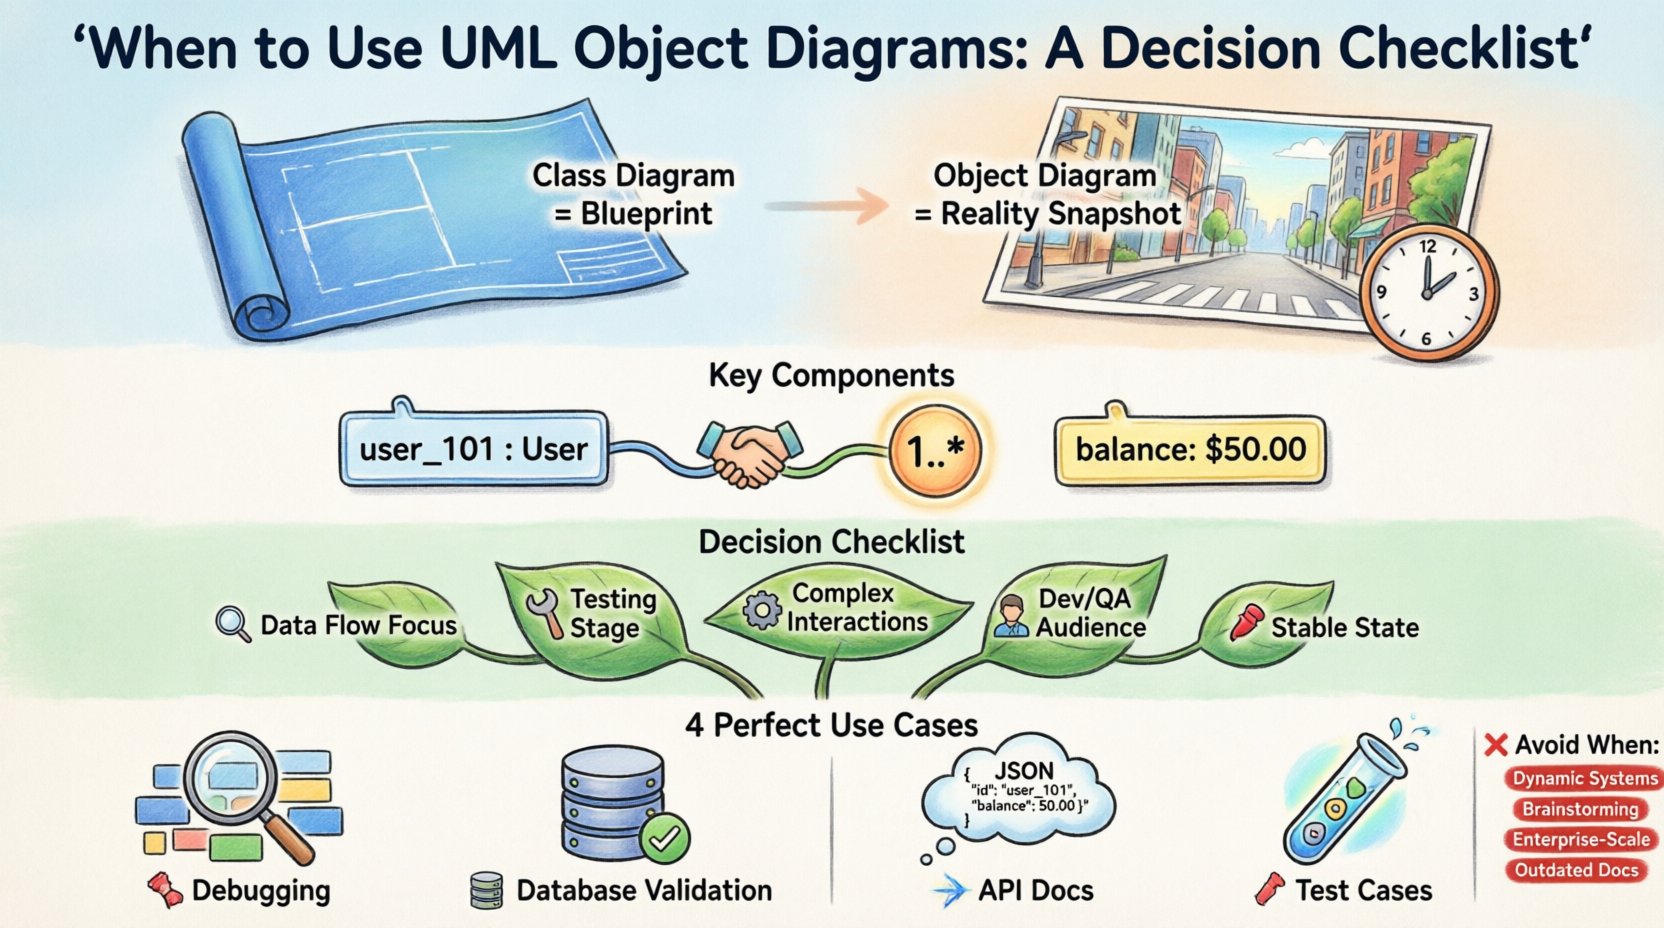
Understanding the Core Purpose 🎯
Before deciding to create an Object Diagram, it is necessary to understand its fundamental nature. It is often referred to as an Instance Diagram. While a Class Diagram defines the blueprint—the types, attributes, and operations available—an Object Diagram defines the reality at a specific point.
Think of the Class Diagram as the architectural plan for a city. It shows where roads go, where buildings stand, and what types of structures are permitted. The Object Diagram is a photograph of that city at 2:00 PM on a Tuesday. It shows the specific cars on the roads, the specific people in the buildings, and the exact traffic flow at that moment.
Key characteristics include:
- Static Snapshot: It captures the state of the system at a specific instance.
- Concrete Instances: It uses specific names for objects (e.g.,
user_101), not just generic types (e.g.,User). - Link Relationships: It shows the actual connections between these specific instances.
- Attribute Values: It can display the specific data held within the objects.
Key Components of an Object Diagram 🧩
To utilize this diagram effectively, you must be familiar with its syntax. Unlike some notations that evolve, UML remains consistent in its representation of objects. The following elements form the backbone of the diagram:
1. Object Instances
Each rectangle represents an object. The name is underlined, indicating it is an instance, not a class. It typically follows the format objectName : ClassName. For example, sessionA : ShoppingCart.
2. Links
Lines connecting the objects represent relationships. These are the active instances of the associations defined in the Class Diagram. They show how specific objects interact with one another.
3. Multiplicity
Just as in Class Diagrams, links have multiplicity constraints. These indicate how many instances of one object can be linked to another at this specific time. Common notations include 1, 0..1, and 1..*.
4. Attribute Values
One of the distinct features of Object Diagrams is the ability to show the actual state. You might see balance: $50.00 inside an object box, providing immediate context on data values.
The Decision Checklist: When to Create One 📋
Not every project requires an Object Diagram. Creating one involves effort and maintenance. Below is a detailed checklist to help you determine if the current phase of your development lifecycle justifies this artifact.
Criteria for Use
| Decision Factor | Yes (Use Object Diagram) | No (Avoid Object Diagram) |
|---|---|---|
| Focus of Analysis | Specific data flow or instance state | General structure or type definitions |
| Stage of Development | Testing, Debugging, or Implementation | Initial Requirements Gathering |
| Complexity | Complex object interactions needed | Simple linear processes |
| Communication Target | Developers or QA Engineers | Stakeholders or Clients |
| Change Frequency | Stable configuration at a point | Rapidly changing dynamic state |
If the majority of your answers align with the “Yes” column, an Object Diagram is likely appropriate.
Scenario 1: Debugging Complex Interactions 🐞
When a system exhibits unexpected behavior, a Class Diagram often lacks the granularity needed to trace the issue. You might know that User connects to Order, but you need to know if user_99 is currently linked to order_500 with a status of pending.
An Object Diagram helps isolate the specific state causing the failure. It allows engineers to visualize:
- Which specific object instances are holding the problematic data.
- How the links between these instances are configured.
- Whether the relationships match the expected logic for that specific instance.
Scenario 2: Database Schema Validation 🗃️
In relational databases, tables correspond to classes, and rows correspond to objects. An Object Diagram can serve as a bridge between the logical model and the physical data.
Use this diagram to:
- Validate that foreign keys are correctly established between specific records.
- Document the expected state of a complex transaction before it commits.
- Ensure that the data structure supports the required multiplicity constraints.
Scenario 3: API Payload Documentation 📡
When defining an API, the request and response bodies are essentially objects. An Object Diagram is highly effective for showing the structure of a JSON payload at a specific endpoint.
It clarifies:
- The exact nesting of objects within a response.
- The required vs. optional attributes for a specific request.
- The relationships between the payload components.
Scenario 4: Test Case Representation 🧪
QA teams often need to understand the state of the system before running a test. Instead of describing a state in text, an Object Diagram provides a visual representation of the pre-conditions.
This is particularly useful for:
- Integration testing where multiple systems interact.
- Regression testing to ensure a specific state change does not break links.
- Explaining complex test scenarios to non-technical team members.
Object Diagrams vs. Class Diagrams: A Deep Dive ⚖️
Confusion often arises between Class Diagrams and Object Diagrams. Both are static structure diagrams, but they serve different masters. Understanding the distinction prevents redundancy and confusion in your documentation.
Scope and Abstraction
A Class Diagram operates at a high level of abstraction. It defines the rules of the game. It says, “Every User can have an Order.” An Object Diagram operates at the level of execution. It says, “This specific User does have an Order right now.”
Time and State
Class Diagrams are timeless. They describe the potential of the system. Object Diagrams are time-bound. They describe the state of the system at a moment. If you change the state of an object (e.g., from active to inactive), the Class Diagram remains unchanged, but the Object Diagram would change.
Maintenance Effort
Class Diagrams are generally stable. Once the architecture is set, they rarely change. Object Diagrams are volatile. They require constant updates to remain accurate as the system evolves. Therefore, they should not be used for high-level architectural overviews intended for long-term reference.
Practical Applications in Development 🛠️
Beyond the checklist, there are specific workflows where Object Diagrams shine. Integrating them into your process can improve communication and reduce errors.
1. Onboarding New Developers
When a new engineer joins a complex project, the Class Diagram provides the vocabulary, but the Object Diagram provides the context. Showing a diagram of a specific transaction flow helps them understand how the components interact in practice. It reduces the cognitive load of translating abstract types into concrete usage.
2. Design Review Sessions
During code reviews or architecture design meetings, Object Diagrams can highlight potential issues with data integrity. For example, you might visualize a scenario where a Guest object attempts to access a SecureFile object. The diagram can show that no link exists between them, immediately flagging a logic error.
3. Legacy System Migration
When migrating data from one system to another, the structure of the data is paramount. Object Diagrams help map the source data instances to the target schema. They allow architects to visualize the transformation of specific data points, ensuring no information is lost during the move.
When to Avoid Object Diagrams 🚫
Authority in engineering also means knowing what not to do. There are scenarios where Object Diagrams add noise rather than clarity.
- Highly Dynamic Systems: If the system state changes every millisecond, a static diagram becomes obsolete instantly. Use Sequence Diagrams or State Machine Diagrams instead.
- Initial Conceptualization: When brainstorming, you are exploring types and relationships, not instances. Start with Class Diagrams or Domain Models.
- Large-Scale Enterprise Views: An enterprise system might have millions of objects. Documenting all of them is impossible. Stick to Class Diagrams for the high-level view.
- Low-Fidelity Documentation: If your team does not have a process for maintaining diagrams, creating an Object Diagram will lead to outdated documentation faster than any other type.
Best Practices for Creation ✍️
If you decide to proceed, follow these guidelines to ensure the diagram remains useful.
1. Limit Scope
Do not attempt to diagram the entire system. Focus on a single use case or a specific transaction. A diagram showing 50 objects is harder to read than a diagram showing 5 objects with deep detail.
2. Use Consistent Naming
Ensure object names follow a clear convention. Using prefixes like obj_ or inst_ can help distinguish them from class names in the legend. Consistency prevents confusion between the blueprint and the instance.
3. Annotate Attribute Values
Don’t just show the structure. Show the data. If an object represents a payment, showing the currency and amount adds significant value to the diagram. It turns a structural map into a data map.
4. Link to Code
If possible, link the diagram to the relevant source code or test cases. This ensures the diagram is not an isolated artifact but part of the living documentation. If the code changes, the diagram should be reviewed.
5. Keep it Readable
Use grouping to organize objects. If you have multiple instances of the same class, group them visually. This prevents the diagram from becoming a tangled web of lines. White space is your friend.
Integrating with Other Diagram Types 🧱
An Object Diagram does not exist in isolation. It works best as part of a suite of diagrams.
Pairing with Class Diagrams
The Class Diagram is the parent. The Object Diagram is the child. Always reference the Class Diagram when creating an Object Diagram. This ensures that the types used in the snapshot actually exist in the system design.
Pairing with Sequence Diagrams
Sequence Diagrams show the flow of messages over time. Object Diagrams show the state of the objects receiving those messages. Using them together provides a complete picture: the process (Sequence) and the state (Object).
Pairing with State Machine Diagrams
State Machine Diagrams show how an object changes state. Object Diagrams show the specific state at a point. Together, they help in debugging state transition issues.
Common Pitfalls to Watch For ⚠️
Even experienced engineers can fall into traps when creating these diagrams.
Pitfall 1: Over-Generalization
Using generic names like Object1 or Entity2 defeats the purpose. These diagrams are for understanding specific data. Give objects meaningful names that reflect their role in the system.
Pitfall 2: Ignoring Nulls
Links can be null. If an object does not have a link to another, it should be shown as such. Hiding null links can lead to assumptions about mandatory relationships that do not exist in the code.
Pitfall 3: Static Assumptions
Do not assume the diagram represents a permanent state. Always label it with the context (e.g., “Post-Checkout State”). This reminds the reader that the diagram is a snapshot, not a permanent truth.
Maintaining the Diagram Lifecycle 🔄
Documentation is only valuable if it is accurate. Object Diagrams are particularly prone to becoming stale. To maintain them:
- Update on Change: If the logic for a specific transaction changes, update the diagram.
- Review in Sprint Planning: Include diagram review in your sprint ceremonies if the sprint involves complex data changes.
- Automate Where Possible: Some modeling tools can generate Object Diagrams from running applications or test databases. Use these features to reduce manual maintenance.
- Archive Old Versions: If a diagram represents a legacy state, archive it rather than deleting it. It may be needed for auditing or historical analysis.
Final Thoughts on Implementation 💡
The decision to use a UML Object Diagram should never be automatic. It is a tool for specific problems. When the problem involves understanding the concrete state of instances, the links between them, and the data they hold, this diagram type is unmatched.
By following the decision checklist and adhering to best practices, you can leverage Object Diagrams to reduce ambiguity, improve testing accuracy, and communicate complex data structures effectively. Remember, the goal is clarity, not completeness. A focused diagram that explains one scenario well is far more valuable than a massive diagram that tries to explain everything.
Keep your documentation aligned with the reality of your code. Use Object Diagrams to bridge the gap between the theoretical design and the practical execution. This approach ensures that your architecture remains robust, understandable, and maintainable throughout the lifecycle of the software.