


In the complex landscape of software architecture, understanding the state of a system at a specific moment is as crucial as understanding its potential. UML Object Diagrams provide this critical insight. While class diagrams outline the structural blueprint of a system, object diagrams capture the living, breathing instances that populate that structure during execution. This guide explores how to leverage these diagrams to validate design decisions and communicate system behavior effectively.
Understanding the Core Concept 🧠
An UML Object Diagram is a static view of a system. It represents a snapshot of the system’s state at a particular point in time. Unlike a class diagram, which defines the types and potential behaviors, an object diagram defines specific instances and their current relationships.
- Instances: These represent specific objects created from classes. They have actual data values.
- Links: These represent associations between instances. They show how objects interact physically or logically.
- State: While the diagram is static, it depicts a dynamic state of the system.
Think of a class diagram as a floor plan for a house. It shows where the bedrooms and bathrooms go. An object diagram is a photograph of the house on moving day. It shows which specific furniture is in which room and who is currently occupying it.
Object vs. Class Diagrams 🆚
Confusion often arises between class and object diagrams. Distinguishing between them is essential for accurate modeling. The following table highlights the key differences.
| Feature | Class Diagram | Object Diagram |
|---|---|---|
| Representation | General types or blueprints | Specific instances or objects |
| Notation | Class Name (Bold) | objectName : ClassName (Underlined) |
| Scope | Structural definition | Snapshot of runtime state |
| Utility | Defining structure for developers | Validating logic for stakeholders |
| Change Frequency | Low (Architecture changes rarely) | High (Data changes frequently) |
Syntax and Notation Standards 📝
To ensure clarity, UML Object Diagrams adhere to strict notation rules. Deviating from these can lead to ambiguity during implementation.
Instance Names
Each object box must have a unique name. The convention involves writing the instance name followed by a colon and the class name. The instance name is typically underlined to distinguish it from the class name.
- Format:
instanceName : ClassName - Example:
customer1 : Customer - Visibility: The instance name is visible, but the class name is often implicit in the relationship.
Attribute Values
Unlike class diagrams which list attribute signatures, object diagrams list actual values. This makes them powerful for debugging and testing scenarios.
- Attributes: Listed inside the object box with their current values.
- Operations: Usually omitted in object diagrams unless demonstrating state transitions.
Multiplicity
Multiplicity describes how many instances participate in a link. In object diagrams, this is less about potential quantity and more about actual connectivity.
- 0..1: The link may or may not exist.
- 1: The link must exist.
- 1..*: One or more links must exist.
- Unspecified: The multiplicity is unknown.
Modeling Relationships and Links 🔗
The power of an object diagram lies in the connections between objects. These links represent the actual data flow and interaction paths existing at a specific moment.
Association Links
Association links represent structural relationships. In an object diagram, they show that two instances are connected.
- Direction: Arrows indicate navigability (who knows about whom).
- Role Names: Labels on the line define the specific relationship from the perspective of the connected objects.
Aggregation and Composition
These represent whole-part relationships. Object diagrams help visualize the lifecycle dependency.
- Aggregation: The parts can exist independently of the whole.
- Composition: The parts are owned by the whole and cannot exist without it.
Generalization
Inheritance relationships are also depicted. A specific instance of a subclass is shown connected to an instance of the superclass.
Step-by-Step Construction Process 🛠️
Building an effective object diagram requires a systematic approach. Follow these steps to ensure accuracy and utility.
- Define the Scenario: Identify the specific point in time or process you want to visualize. Is it during login? During checkout?
- Identify Active Instances: List the objects that are currently active and relevant to the scenario.
- Assign Values: Populate the attributes with realistic test data. This helps in validation.
- Draw Links: Connect the objects according to the associations defined in the class diagram.
- Verify Multiplicity: Ensure the number of links matches the defined constraints (e.g., one user, many orders).
- Review Navigation: Check if the arrows correctly represent the data access paths available in the code.
Deep Dive: A Practical Scenario 🏢
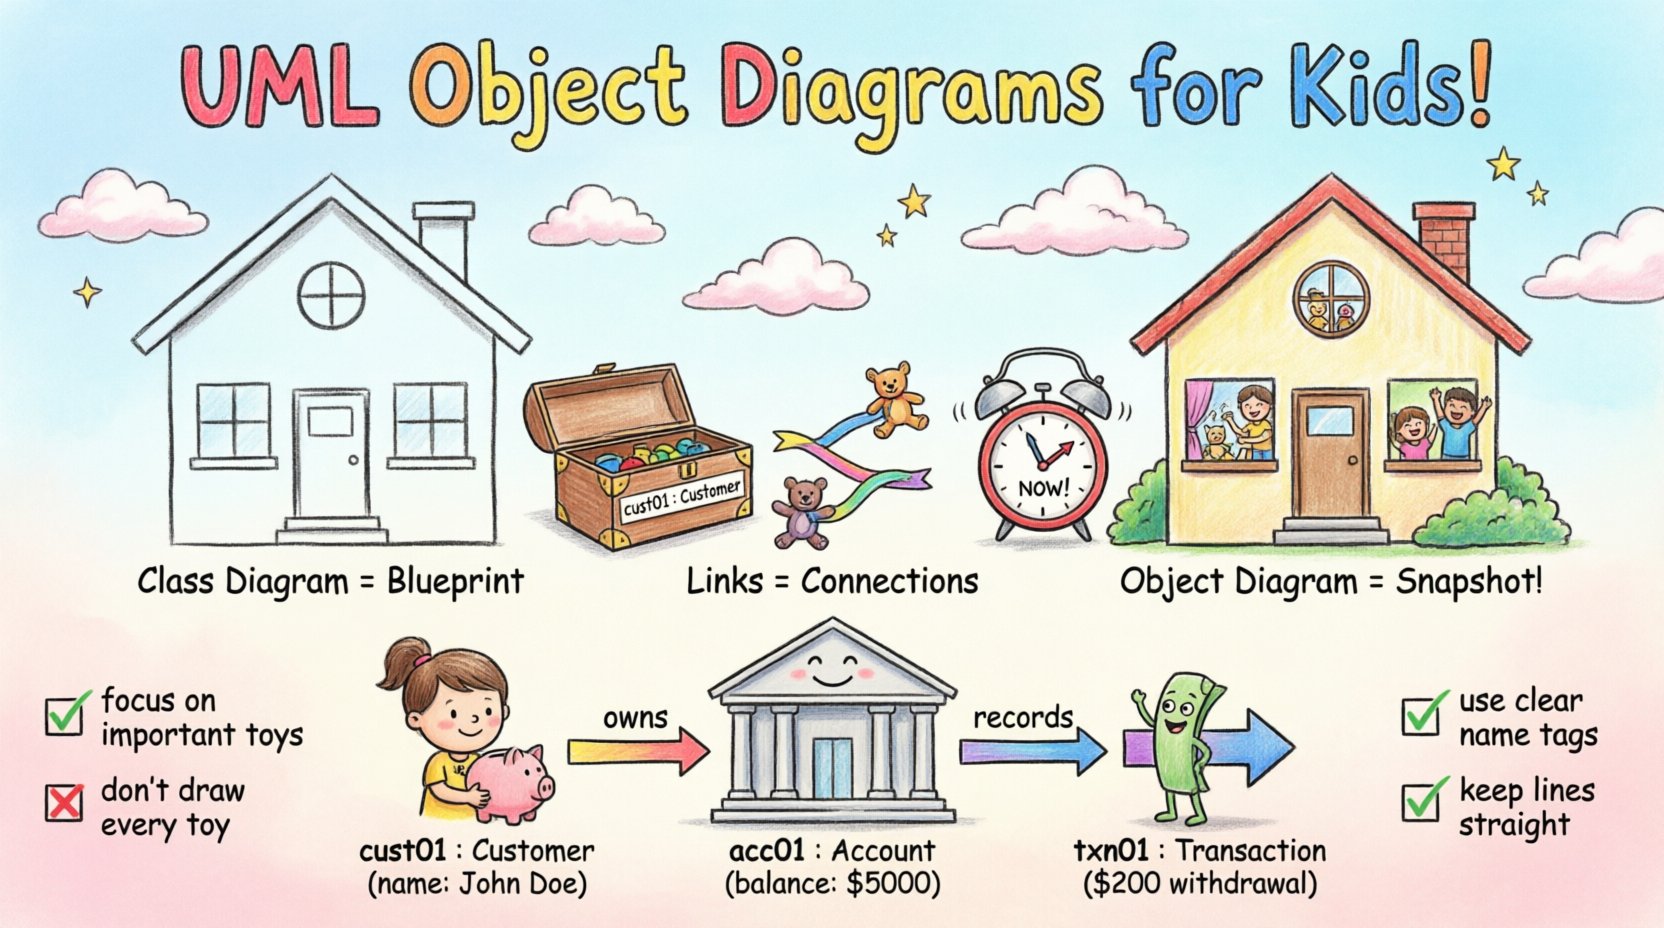
To illustrate the application of these concepts, consider a simplified banking system. We will model the state of a transaction between a customer and a bank account.
Entities Involved
- Customer: The individual initiating the transaction.
- Account: The financial repository holding the funds.
- Transaction: The record of the money movement.
Instance Details
cust01 : Customer- name: John Doe
- accountNumber: 123456789
acc01 : Account- balance: 5000.00
- type: Savings
txn01 : Transaction- amount: 200.00
- type: Withdrawal
Relationships
cust01is linked toacc01via an owns relationship.acc01is linked totxn01via a records relationship.
This snapshot shows that John Doe owns one savings account, which has recorded a specific withdrawal. If this were a class diagram, we would see the classes Customer, Account, and Transaction without the specific names or values. The object diagram validates that the logic holds for this specific data set.
Integration with Other UML Diagrams 🔗
Object diagrams do not exist in isolation. They complement other modeling artifacts to provide a complete picture of system behavior.
Sequence Diagrams
Sequence diagrams show the flow of messages over time. Object diagrams can be extracted from a sequence diagram to show the state of objects after a specific interaction sequence completes.
- Before: Objects are in their initial state.
- After: Object diagram shows the updated state.
State Machine Diagrams
State machines define how a single object changes state. Object diagrams show the aggregate state of all objects in the system simultaneously.
- State Diagram: Focuses on one object’s lifecycle.
- Object Diagram: Focuses on the system-wide snapshot.
Common Pitfalls and Best Practices ⚠️
Creating object diagrams can lead to clutter if not managed carefully. Adhere to these guidelines to maintain clarity.
Over-Modeling
Do not include every single object in the system. An object diagram should focus on the specific scenario being analyzed. Including irrelevant objects obscures the relationships that matter.
- Focus: Limit the diagram to the active participants of the use case.
- Simplify: Hide objects that are not directly involved in the current context.
Confusing Structure with Behavior
While object diagrams show instances, they do not show behavior logic. Do not attempt to depict algorithms or complex logic flow within the object boxes.
- Use: For structure and state.
- Don’t Use: For processing logic or timing constraints.
Naming Conventions
Consistent naming is vital. Use a standard prefix for instances to make them easily identifiable across multiple diagrams.
- Prefix: Use
obj_orinst_to denote instances. - Uniqueness: Ensure instance names are unique within the diagram scope.
Link Clarity
Links should be straight and labeled clearly. Avoid crossing lines where possible to maintain readability.
- Orthogonal Layout: Use right angles for connecting lines.
- Role Labels: Always label the link with the role name if the association is ambiguous.
Summary of Key Takeaways ✅
UML Object Diagrams are a specialized tool for visualizing the runtime state of a system. They bridge the gap between abstract class structures and concrete data instances.
- Snapshot Utility: They capture the system at a specific moment, aiding in debugging and validation.
- Instance Focus: They deal with specific objects and their actual attribute values, not just types.
- Relationship Validation: They confirm that associations and links function as intended with real data.
- Complementary Tool: They work best when used alongside class, sequence, and state diagrams.
By adhering to notation standards and focusing on relevant scenarios, architects and developers can use object diagrams to reduce ambiguity. They serve as a reference point for understanding how data flows through the system during execution. Proper modeling of these instances ensures that the underlying code aligns with the intended design.
When reviewing a design, ask if the static structure supports the dynamic requirements. Object diagrams provide the evidence needed to answer that question. They transform abstract concepts into tangible realities, allowing teams to verify system behavior before code is finalized. This proactive approach minimizes defects and enhances the reliability of the software architecture.
Remember that a diagram is a communication tool. If it cannot be understood by the team, it has failed its purpose. Keep it simple, keep it accurate, and keep it relevant to the scenario at hand.