


Software development involves managing complexity. As systems grow, the static structure of code often fails to represent the dynamic reality of execution. This is where the UML Object Diagram becomes essential. Unlike class diagrams that define types, object diagrams capture instances at a specific moment. They serve as a snapshot of the system’s state, providing clarity where text descriptions often fall short.
Understanding how these diagrams influence project outcomes requires a deep dive into their mechanics, their role in communication, and their practical application in reducing risk. This guide explores the tangible benefits of using object diagrams to maintain control over data relationships and system behavior.
📸 Understanding the Snapshot Concept
An object diagram represents a specific configuration of objects and their relationships at a particular point in time. Think of it as a photograph taken from a video feed. While the video (or the class diagram) shows how things can move, the photograph shows how they are positioned right now.
Why does this distinction matter for project success? Because many bugs arise not from incorrect logic, but from incorrect states. When developers assume an object exists in a certain state without verification, runtime errors occur. Object diagrams force the team to acknowledge the state of data before implementation begins.
- Concrete Representation: They replace abstract classes with actual instances.
- State Visibility: They show the current values of attributes.
- Relationship Verification: They validate how objects link to one another.
- Scope Definition: They clarify which objects are active in a specific scenario.
By visualizing the instance level, teams can identify potential issues with memory allocation, reference cycles, or null pointer exceptions before writing a single line of code.
⚖️ Distinguishing Static Structure from Runtime Reality
It is common to confuse class diagrams with object diagrams. Both are structural diagrams, but they serve different purposes. Confusing them can lead to design flaws where the implementation does not match the architectural intent.
The Role of Class Diagrams
Class diagrams describe the blueprint. They define the properties and methods available to an entity. They are static and apply to all instances of a class. They do not show data values or specific relationships formed during execution.
The Role of Object Diagrams
Object diagrams describe the realization. They show specific objects created from those classes. They display the links that actually exist during a session. They are dynamic in the sense that they represent a moment in the lifecycle of the software.
| Feature | Class Diagram | Object Diagram |
|---|---|---|
| Focus | Types and Structures | Instances and Data |
| Time | Permanent Definition | Point-in-Time Snapshot |
| Instances | Abstract | Concrete |
| Use Case | Design Phase | Validation & Debugging |
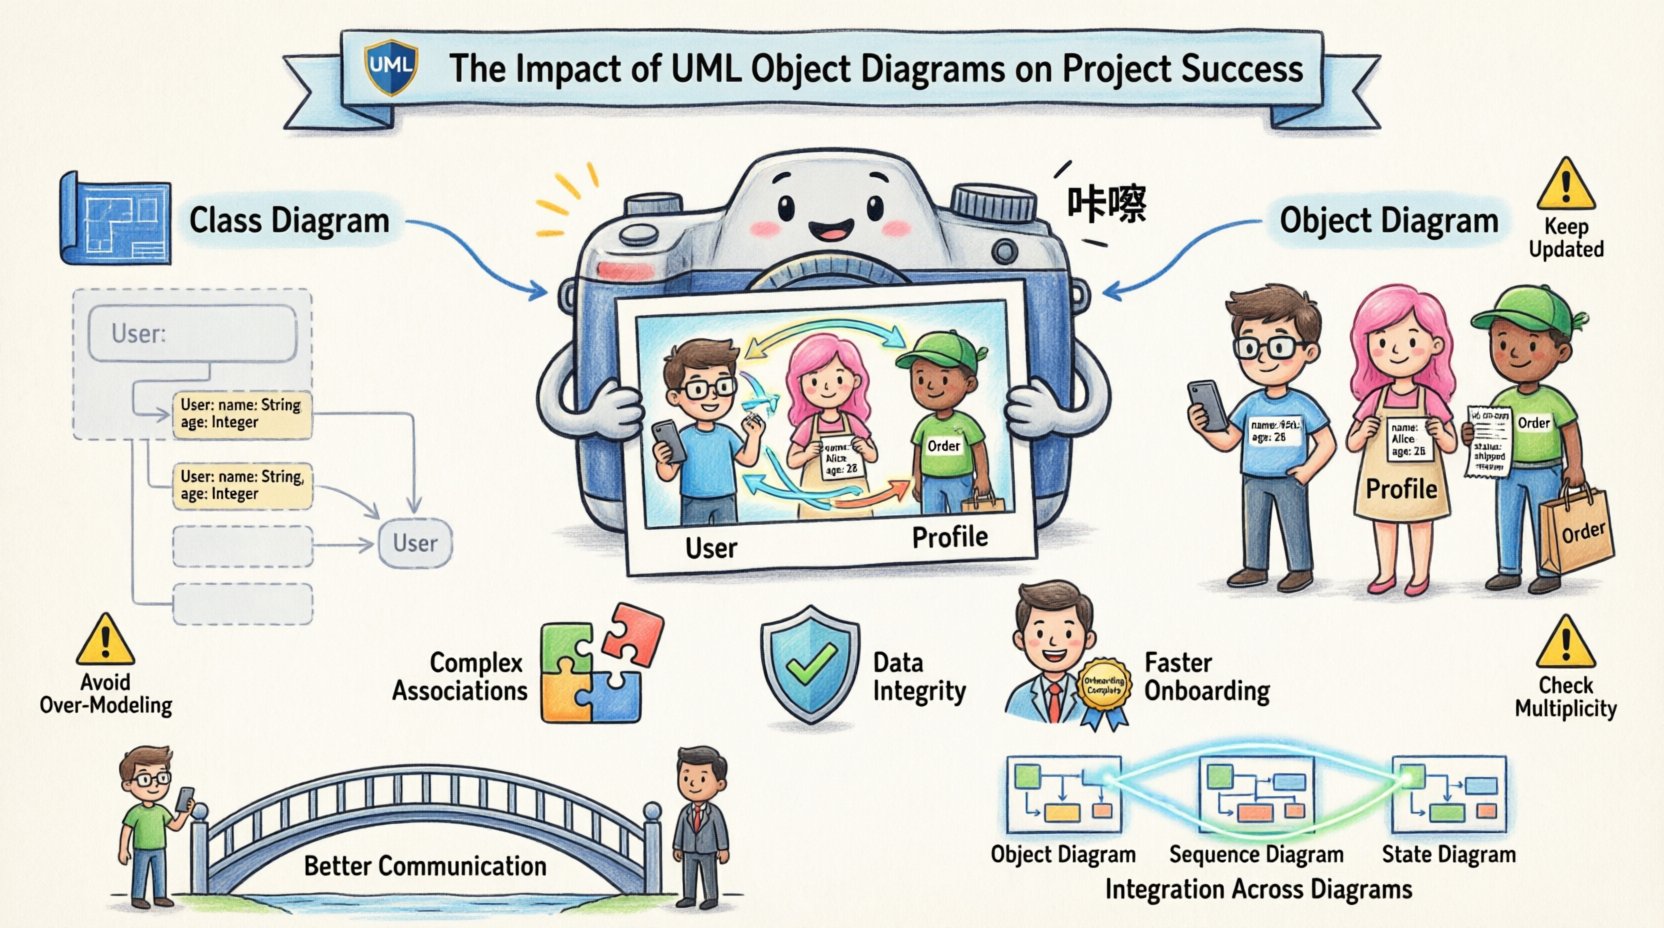
This table highlights why relying solely on class diagrams can be risky. A class diagram might show that two classes are connected, but an object diagram reveals if that connection is valid for the current data set. For example, a User class might link to a Profile class, but the object diagram shows that the current User instance has no Profile yet.
🛠️ Key Benefits for Development Teams
Integrating object diagrams into the workflow provides measurable advantages. These advantages translate to reduced technical debt, fewer production incidents, and clearer codebases.
1. Clarifying Complex Associations
Modern applications often involve complex relationships. One object might reference dozens of others. Tracing these links in code can be tedious. An object diagram maps these connections visually.
- Identify Orphans: See objects that are not linked to any parent.
- Check Cardinality: Ensure the number of links matches the design rules.
- Spot Cycles: Visual loops can indicate potential infinite recursion or garbage collection issues.
2. Enhancing Data Integrity
Data integrity relies on correct object states. If a transaction requires three objects to be active simultaneously, an object diagram can confirm this requirement. If the diagram shows a missing link, the team knows the transaction will fail.
- Validation: Verify that required attributes have values.
- Constraints: Ensure that object states adhere to business rules.
- Initialization: Confirm that objects are created in the correct order.
3. Accelerating Onboarding
When new developers join a project, understanding the data model is crucial. Reading code is slow. Reading a diagram is fast. An object diagram provides a concrete example of how data flows through the system, reducing the time required for a new team member to become productive.
🤝 Enhancing Stakeholder Communication
Projects fail when expectations do not align between technical and non-technical stakeholders. Developers think in code; business leaders think in processes. Object diagrams bridge this gap.
A class diagram is too abstract for a business analyst to understand fully. A sequence diagram is too focused on time. An object diagram shows the data entities involved in a specific business transaction. It answers the question: “What data exists when this sale is completed?”
Benefits for Non-Technical Roles
- Visualizing Reality: Stakeholders can see the data they care about.
- Requirement Validation: They can verify that the system captures all necessary information.
- Feedback Loop: It is easier to point to a diagram and say, “This link is missing,” than to describe it in text.
This clarity reduces the risk of scope creep and rework. When everyone agrees on the state of the data, the definition of done becomes much clearer.
🔗 Integration with Sequence and State Diagrams
Object diagrams do not exist in isolation. They work best when combined with other UML diagrams. This integration creates a comprehensive view of the system.
Connection to Sequence Diagrams
Sequence diagrams show the flow of messages over time. Object diagrams show the objects that receive those messages. By cross-referencing them, you ensure that the objects created in the sequence diagram actually exist in the object diagram.
- Consistency Check: Do the objects in the sequence match the instances in the object diagram?
- Message Flow: Does the message flow create the state shown in the object diagram?
Connection to State Diagrams
State diagrams describe how a single object changes over time. Object diagrams show that object alongside its peers. Together, they explain not just how an object changes, but how that change affects the system.
- Context: State diagrams focus on one entity; object diagrams provide context.
- Impact: Changing one object’s state often impacts others; the object diagram shows these side effects.
⚠️ Common Pitfalls in Modeling Objects
Even with the best intentions, teams can misuse object diagrams. Understanding these pitfalls helps avoid common traps that negate the benefits.
1. Over-Modeling
Creating an object diagram for every possible state leads to a massive, unmanageable documentation burden. This consumes time that could be spent on development.
- Solution: Only diagram critical scenarios or complex states.
- Solution: Focus on the most frequent or error-prone interactions.
2. Lack of Maintenance
Diagrams become outdated quickly. If the code changes but the diagram does not, the diagram becomes misleading. Relying on misleading diagrams is worse than having no diagrams at all.
- Solution: Treat diagrams as living documents.
- Solution: Update diagrams during code reviews.
- Solution: Use tools that support synchronization where possible.
3. Ignoring Multiplicity
Object diagrams often fail to show the correct multiplicity of links. An object might be linked to one item, but the system expects ten. Failing to represent this accurately hides potential logic errors.
- Solution: Explicitly label links with their cardinality.
- Solution: Verify multiplicity against the class definition.
📋 Strategic Implementation Guidelines
To maximize the impact of object diagrams on project success, teams should adopt a disciplined approach. This involves planning, execution, and review.
Phase 1: Planning
Identify the critical paths in the system. Where is the data most complex? Where do errors usually occur? These are the areas where object diagrams provide the highest return on investment.
- Identify Key Scenarios: Select the top 10% of use cases that handle 90% of the data.
- Define Scope: Decide which objects are necessary for the diagram. Exclude helper objects that do not affect the core flow.
Phase 2: Execution
Draw the diagrams using standard notation. Ensure that object names follow the naming conventions of the codebase. This makes the diagram readable for developers.
- Use Clear Naming: Object names should be descriptive (e.g.,
activeSession_001instead ofobj1). - Label Links: Clearly label associations to show the nature of the relationship.
- Group Objects: Use swimlanes or boundaries to group related objects logically.
Phase 3: Review
Integrate diagram review into the existing quality assurance process. Do not treat diagrams as a separate task.
- Peer Review: Have another developer verify the links and states.
- Stakeholder Check: Ask a business analyst if the data state matches the business requirement.
- Automation: Where possible, generate diagrams from code to ensure accuracy.
🚀 Long-Term Project Health
The impact of object diagrams extends beyond the immediate development cycle. They contribute to the long-term health of the project.
Reducing Technical Debt
Technical debt accumulates when shortcuts are taken. Skipping object modeling often leads to sloppy data handling. This creates a fragile codebase that breaks easily when requirements change. Object diagrams enforce discipline in data modeling.
Facilitating Refactoring
When refactoring, developers need to know how objects are connected. Changing a class structure might break links that are not obvious in the code. An object diagram reveals these connections instantly.
- Impact Analysis: See what breaks before you change code.
- Migration: Plan data migration strategies based on current states.
Supporting Testing
Testers need to know what state the system should be in after a test case runs. Object diagrams provide the expected state. This makes writing test cases more accurate and effective.
- Preconditions: Define the setup state clearly.
- Postconditions: Define the expected result state.
🧩 Conclusion
The decision to use UML object diagrams is a strategic choice that influences the quality and stability of software projects. They are not merely drawings; they are tools for thinking and communicating about data.
By focusing on instances rather than types, teams gain visibility into the runtime behavior of their systems. This visibility leads to fewer bugs, better communication, and more maintainable code. While they require effort to create and maintain, the cost of not having them is often higher in the form of debugging time and production failures.
Successful projects rely on clarity. Object diagrams provide that clarity by turning abstract relationships into concrete realities. When teams commit to this practice, they build systems that are robust, understandable, and aligned with business needs.
Start small. Pick one complex module. Draw its object diagram. Review it with the team. Observe the insights gained. This incremental approach ensures that the practice becomes a natural part of the development process, driving success without overwhelming the team.