


In the world of software architecture, visualizing structure is just as critical as writing the code itself. Among the various modeling tools available, the UML Object Diagram serves a unique purpose. It provides a snapshot of the system at a specific moment in time, focusing on instances rather than general classes. This guide explores the mechanics, syntax, and practical applications of object diagrams to help you understand static structure modeling.
Unlike class diagrams that describe the blueprint, object diagrams describe the actual furniture built from that blueprint. They are essential for debugging, documentation, and communicating complex data states to stakeholders.
🧩 Understanding the Core Concept
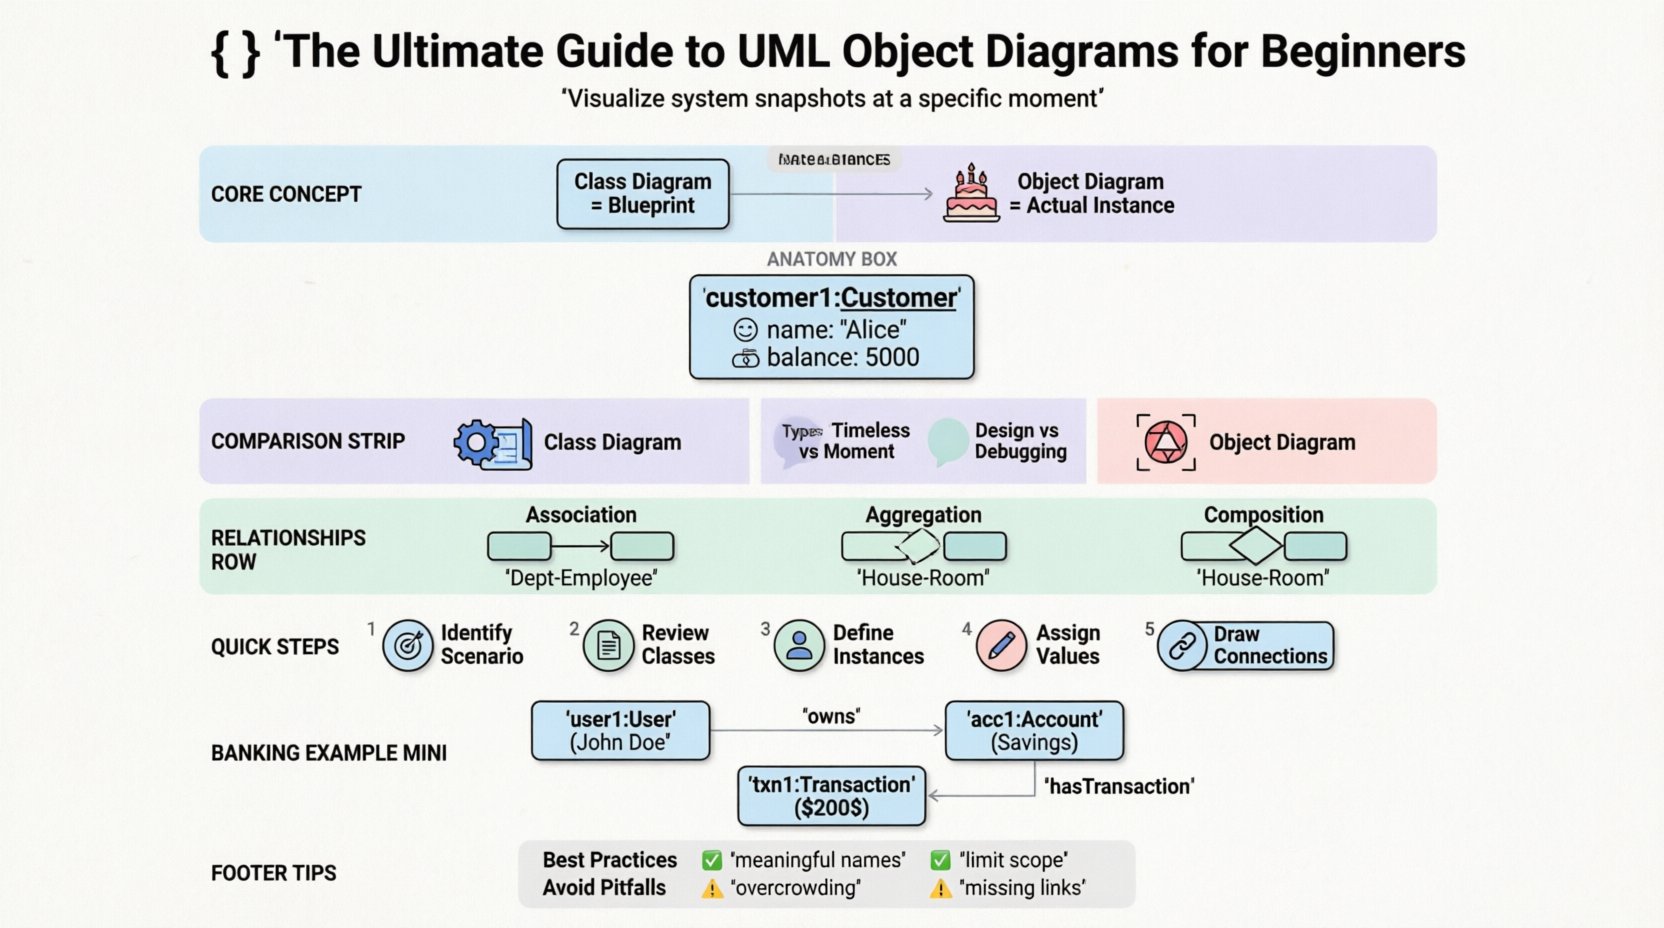
An Object Diagram is a type of static structure diagram in the Unified Modeling Language (UML). It shows a complete or partial view of the system’s structure at a specific point in time. While a class diagram defines types, an object diagram defines instances.
Think of a class diagram as a recipe for a cake. It tells you what ingredients are needed and the steps to mix them. An object diagram is the actual cake sitting on the table. It shows the specific state of that cake at the moment you take a picture of it.
Key Characteristics
- Static View: It does not show behavior or flow, only structure.
- Runtime Snapshot: It represents the state of the system during execution.
- Instance-Based: Focuses on specific objects rather than abstract classes.
- Verification Tool: Used to validate that the class diagram design can actually support the required data interactions.
🏗️ Anatomy of an Object Diagram
To read or create an object diagram effectively, one must understand its constituent parts. Every element follows a strict notation system.
1. Object Instances
Objects are the primary building blocks. They are represented by rectangles. The name of the object is written in bold and underlined, followed by a colon and the class name.
- Format: objectName:ClassName
- Example: customer1:Customer
If an object has no specific name, it may be represented simply by the class name, but naming instances helps clarify which specific entity is being discussed.
2. Attributes and Values
Objects contain attributes, just like classes. However, in an object diagram, these attributes hold specific values, not just data types.
- Class Diagram: Shows name: String
- Object Diagram: Shows name: “Alice”
This distinction is vital. It allows developers to see exactly what data exists in memory at a given time.
3. Links and Associations
Links represent the connections between objects. They correspond to the associations defined in the class diagram. A link connects two specific objects.
- Direction: Arrows indicate navigability or relationship direction.
- Labeling: Links can be named to describe the nature of the connection.
- Multiplicity: The ends of the links show how many objects can be connected.
📋 Object Diagram vs. Class Diagram
Confusion often arises between class diagrams and object diagrams. While they look similar, their intent differs significantly. The table below clarifies the distinctions.
| Feature | Class Diagram | Object Diagram |
|---|---|---|
| Focus | Types and Structure | Instances and State |
| Time | General, timeless | Specific moment in time |
| Content | Class names, types, methods | Object names, values, links |
| Use Case | Design phase | Debugging, Testing, Documentation |
| Symbolism | Underlined class name | Underlined object name + class name |
Understanding this difference prevents misinterpretation. When designing a database schema, you rely on the class diagram. When reviewing a live server log to debug a memory leak, you might sketch an object diagram to visualize the current heap state.
🔗 Relationships and Multiplicity
The relationships between objects dictate how data flows and connects. These relationships mirror those in the class diagram but apply to concrete instances.
Association
An association represents a structural link between objects. It implies that one object knows about another.
- Unidirectional: One object navigates to the other.
- Bidirectional: Both objects can navigate to each other.
Aggregation
Aggregation represents a “whole-part” relationship where the part can exist independently of the whole.
- Example: A Department has Employees.
- Behavior: If the Department is removed, the Employees still exist.
Composition
Composition is a stronger form of aggregation. The part cannot exist without the whole.
- Example: A House has Rooms.
- Behavior: If the House is destroyed, the Rooms cease to exist.
Inheritance (Realization)
While less common in object diagrams, inheritance relationships can be shown. This indicates that an object is an instance of a subclass and shares properties with the superclass.
🛠️ Steps to Create an Object Diagram
Creating a valid object diagram requires a methodical approach. Follow these steps to ensure accuracy and clarity.
- Identify the Scenario: Determine the specific moment in time you want to capture. Is it during login? After a purchase? During a system crash?
- Review the Class Diagram: Ensure your class diagram is finalized. You cannot create valid instances without defined types.
- Define Instances: Create objects for every class involved in the scenario. Name them meaningfully.
- Assign Values: Populate the attributes with concrete values relevant to the scenario.
- Draw Links: Connect the objects based on the associations defined in the class diagram.
- Verify Multiplicity: Check that the number of links adheres to the multiplicity constraints (e.g., 1 to 0..*).
- Review for Consistency: Ensure no dangling links or unconnected objects exist unless intentional.
🚀 Practical Example
Consider an online banking system. We want to visualize a specific transaction.
Classes Involved
- User: Contains id, name, balance.
- Account: Contains accountNumber, type.
- Transaction: Contains date, amount, type.
Object Scenario
A user named John Doe performs a withdrawal from his Savings Account.
Diagram Elements
- Object 1: user1:User (name: “John Doe”, balance: 5000)
- Object 2: acc1:Account (accountNumber: “12345”, type: “Savings”)
- Object 3: txn1:Transaction (amount: 200, date: “2023-10-01”)
Links
- user1 to acc1: Labeled “owns” (Multiplicity 1 to 1)
- acc1 to txn1: Labeled “hasTransaction” (Multiplicity 1 to 0..*)
This visual representation allows a developer to see exactly how John’s account balance interacts with the transaction record at that specific second.
✅ Best Practices for Clarity
A diagram that is too complex becomes useless. Adhere to these guidelines to maintain readability.
- Limit Scope: Do not draw the entire system. Focus on a specific use case or feature.
- Use Meaningful Names: Avoid generic names like “object1”. Use “customer1” or “order42”.
- Keep it Flat: Avoid nesting objects unless necessary for composition. Keep the layout logical.
- Color Coding: While CSS is not allowed in the source, visually distinct shapes or colors can be used in tools to denote status (e.g., red for error states).
- Annotate: Use notes to explain complex relationships that are not obvious from the lines alone.
❌ Common Pitfalls to Avoid
Even experienced modelers make mistakes. Watch out for these common errors.
| Pitfall | Consequence | Solution |
|---|---|---|
| Ignoring Multiplicity | Invalid data models | Check cardinality constraints |
| Mixing Class and Object Notation | Confusion for readers | Ensure all names are instances |
| Overcrowding | Diagram becomes unreadable | Split into multiple diagrams |
| Missing Links | Broken logic flow | Verify associations |
| Static Values Only | Loss of context | Include enough context to understand state |
🧠 When to Use Object Diagrams
Not every project needs an object diagram. Use them when the following conditions apply.
- Complex State Management: When object interactions are too complex to describe in text.
- Database Design Validation: To ensure foreign keys and relationships map correctly.
- Debugging: To trace the flow of data during an error.
- Onboarding: To help new team members understand the data structure quickly.
- Testing: Test cases often rely on specific object states to verify functionality.
Conversely, avoid them for high-level architectural overviews where class relationships are sufficient. They can become outdated quickly as the system evolves.
🔄 Evolving from Static to Dynamic
While object diagrams are static, they often serve as the foundation for dynamic modeling. Sequence diagrams and communication diagrams build upon the objects defined in an object diagram.
By defining the objects and their relationships first, you ensure that the interactions in subsequent diagrams are valid. It acts as a contract for the dynamic behavior.
📝 Summary of Notation Rules
For quick reference, here is a checklist for drawing notation correctly.
- Object Name: Underlined text.
- Class Name: Text after the colon.
- Attribute: Listed inside the object box.
- Value: Assigned to the attribute (e.g., “value”).
- Link: Straight or curved line connecting boxes.
- Arrowhead: Indicates direction of navigation.
- Label: Text describing the link.
- Multiplicity: Numbers at the end of the link (e.g., 1, 0..*, 1..*).
🎯 Final Thoughts
Mastering UML Object Diagrams requires practice and a deep understanding of the underlying system architecture. They are not merely drawings; they are precise descriptions of runtime reality. By focusing on instances, values, and specific relationships, these diagrams bridge the gap between abstract design and concrete implementation.
Start with small scenarios. Draw the objects you interact with daily. Gradually expand to complex interactions. With time, you will find that these diagrams become an essential part of your technical communication toolkit, providing clarity where text often fails.