


In the landscape of software architecture and system design, visualizing static structures is crucial for understanding how data behaves at a specific moment in time. The Unified Modeling Language (UML) provides a standardized notation for this purpose. Among the various diagram types available, the Object Diagram stands out as a critical tool for capturing a snapshot of a system. This guide explores the intricacies of object diagrams, breaking down their definitions, structural components, and practical applications without relying on specific tools or proprietary software.
What is an Object Diagram? 🤔
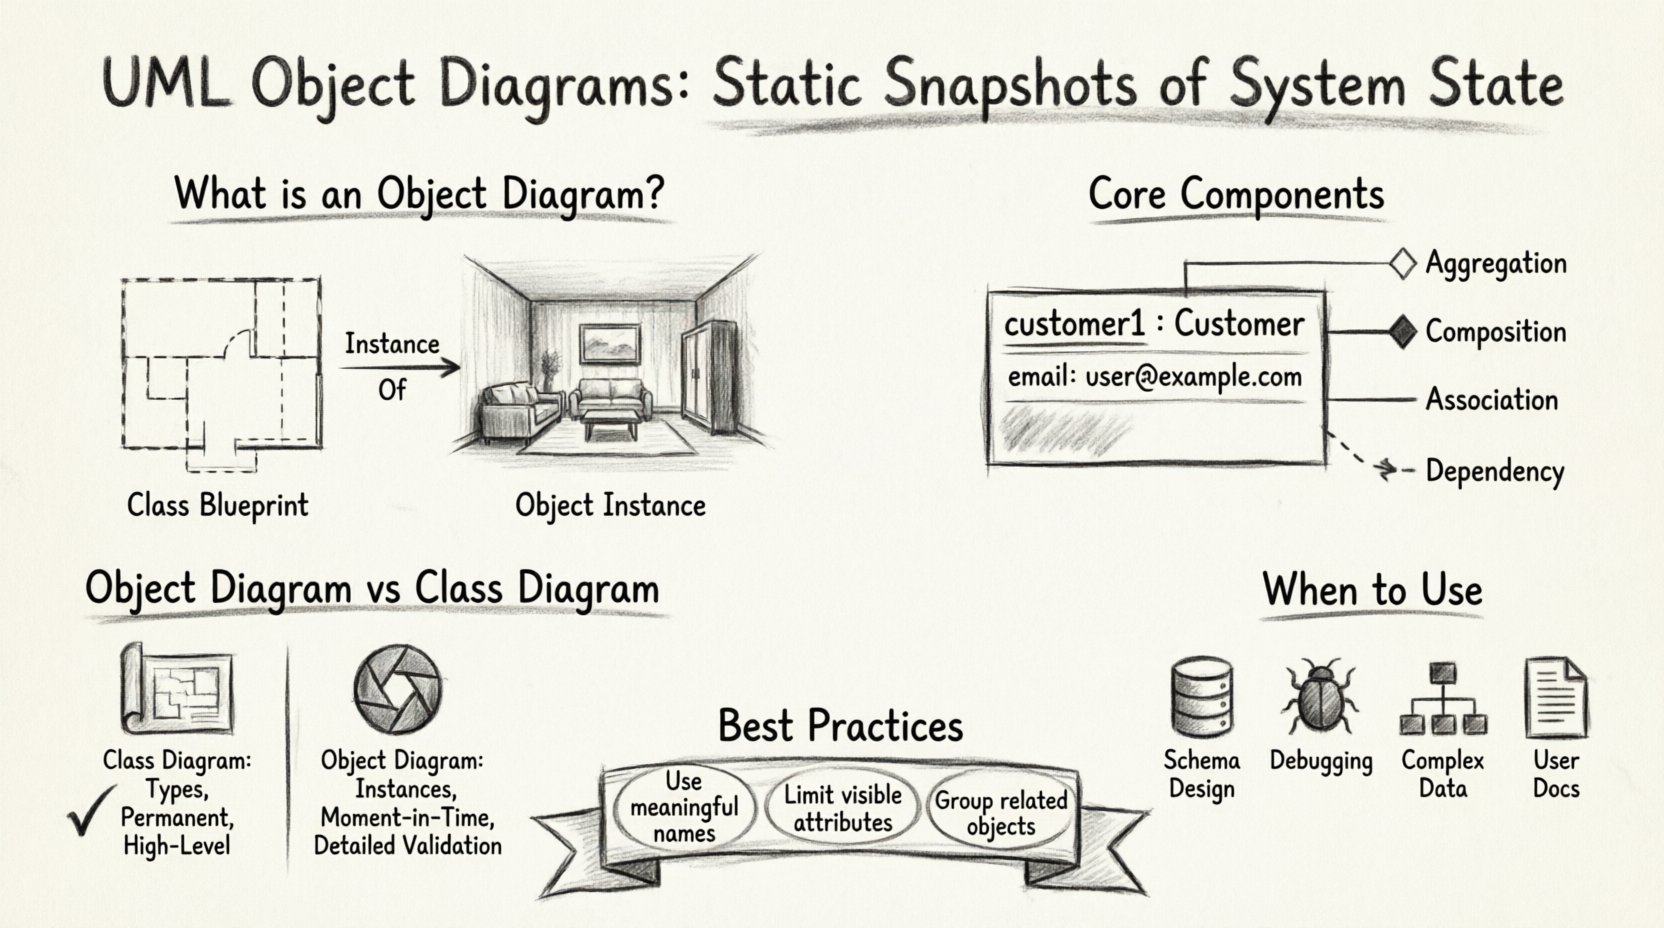
An object diagram is a static structure diagram that describes the structure of a system by showing the objects of that system and their relationships. Unlike a class diagram, which defines the blueprint or type, an object diagram represents a specific instance of that blueprint at a given point in time. Think of the class diagram as the architectural plan for a house, and the object diagram as a photograph of a completed room within that house.
This type of diagram is particularly useful for:
- Visualizing complex relationships between data instances.
- Documenting the state of a system during execution.
- Validating the structure defined in class diagrams.
- Clarifying the data flow and connectivity for database schema design.
The primary purpose is to provide a clear view of how objects interact within a specific context. It allows stakeholders to see the actual data values and links rather than just the potential types. This distinction is vital when debugging or designing systems where the initial configuration of data is complex.
Core Components of an Object Diagram 🧩
Understanding the building blocks of an object diagram is essential for creating accurate and readable models. Each element serves a specific function in defining the instance and its connections. The following components form the foundation of this modeling technique.
1. Object Instances
Objects are the central elements of this diagram. They represent specific instances of a class. In the visual representation, an object appears as a rectangular box divided into compartments. The top compartment contains the object name and the class name it instantiates.
- Object Name: This identifies the specific instance. It is often italicized and underlined to distinguish it from the class name.
- Class Name: This appears after a colon (:) following the object name. It indicates which class the object belongs to.
- Example:
customer1 : Customerrepresents an instance named customer1 of the class Customer.
2. Attributes and Values
The middle compartment of the object box lists the attributes of the instance. Unlike a class diagram where attributes describe types (e.g., String or Integer), an object diagram lists the actual values assigned to those attributes.
- Attribute Name: The property being described.
- Attribute Value: The specific data held by the instance.
- Format: Typically written as attributeName : value.
For example, an object representing a user might show email : [email protected]. This level of detail helps in verifying data integrity and constraints.
3. Links and Relationships
Objects rarely exist in isolation. Links represent associations between objects. These lines connect the boxes and indicate a structural relationship. Links can be:
- Association Links: Show a direct relationship between two instances.
- Multiplicity: Defined at the ends of the link to specify how many instances can be connected (e.g., one-to-many).
- Role Names: Labels on the link line that describe the nature of the relationship from the perspective of each object.
4. Navigation Arrows
While object diagrams are primarily static, they often imply navigability. A solid line usually indicates a bidirectional link, meaning both objects know about each other. An arrowhead can indicate a unidirectional association, where only one object has a reference to the other.
Syntax and Notation Standards 📐
Consistency in notation ensures that anyone reading the diagram understands the design intent. Adhering to standard conventions prevents ambiguity. Below are the key rules for creating a compliant object diagram.
- Rectangular Shape: All objects must be drawn as rectangles.
- Three Compartments: Standard boxes are divided into three sections: Object Name, Attributes, and Operations (though operations are rarely shown in object diagrams).
- Font Style: Instance names are often italicized to differentiate them from class names, which remain in standard typeface.
- Link Lines: Use straight lines to connect objects. Avoid curves unless necessary for clarity in complex layouts.
- Labeling: Every link should ideally have a role name or multiplicity if it adds clarity to the relationship.
When documenting complex systems, it is helpful to group related objects together spatially. This spatial clustering helps the viewer understand logical domains without needing excessive connecting lines.
Object Diagram vs. Class Diagram 🔄
Confusion often arises between object diagrams and class diagrams because both depict structure. However, their scope and usage differ significantly. The table below outlines the key distinctions.
| Feature | Class Diagram | Object Diagram |
|---|---|---|
| Focus | Defines the blueprint and types. | Shows specific instances and data. |
| Timeframe | Static and permanent. | Snapshot at a specific moment. |
| Instance Names | None (only class names). | Includes specific instance names. |
| Attribute Values | Shows data types (e.g., int). | Shows actual values (e.g., 5). |
| Usage | High-level design and documentation. | Detailed validation and testing scenarios. |
| Complexity | Generally simpler for high-level views. | Can become complex with many instances. |
While a class diagram tells you what the system can hold, an object diagram tells you what the system does hold in a specific scenario. For instance, a class diagram defines a Car with an Engine. An object diagram might show a specific Toyota_Camry linked to a specific V8_Engine_Instance.
When to Utilize Object Diagrams 🛠️
Not every project requires an object diagram. Over-modeling can lead to confusion and maintenance overhead. Use these diagrams when the specific state of data matters more than the general type structure.
1. Database Schema Design
Before implementing a database, it is often helpful to visualize the data instances. Object diagrams help identify foreign key relationships and cardinality issues that might not be obvious in a high-level class diagram.
2. Debugging and Testing
When a bug occurs, developers often need to trace the state of objects involved. An object diagram can document the exact state of the system when the error happened, providing a clear reference for the fix.
3. Complex Data Structures
For systems with intricate data hierarchies (such as financial ledgers or medical records), object diagrams clarify how data aggregates. They show how a parent object relates to child objects with actual values.
4. User Documentation
End-user documentation sometimes benefits from object diagrams to show what data fields are populated in a specific view. This helps users understand the scope of the information available to them.
Relationship Modeling in Object Diagrams 🔗
Modeling relationships is where object diagrams truly shine. Unlike class diagrams which show potential associations, object diagrams show actual links. The following relationship types are commonly represented.
- Association: A structural relationship where objects are connected. In object diagrams, this is a solid line between two boxes.
- Aggregation: A whole-part relationship where the part can exist without the whole. Visually, this is similar to association but often implies a weaker link.
- Composition: A stronger form of aggregation where the part cannot exist without the whole. If the whole is destroyed, the part is destroyed too.
- Dependency: A relationship where one object uses or depends on another for a short period. This is often represented with a dashed line.
It is important to note multiplicity in these relationships. For example, a Department object might be linked to multiple Employee objects. The link would show a multiplicity of 1..* at the employee end. This visual cue prevents ambiguity about how many instances can be connected.
Common Pitfalls and Solutions ⚠️
Creating object diagrams is straightforward, but mistakes can lead to misinterpretation. Being aware of common errors helps maintain model quality.
- Overcrowding: Trying to show too many instances in one diagram reduces readability. Solution: Break the model into multiple diagrams based on logical domains or subsystems.
- Inconsistent Naming: Using different names for the same class across diagrams creates confusion. Solution: Maintain a strict naming convention across all models.
- Mixing Levels of Detail: Combining high-level classes with low-level instances in the same view. Solution: Keep class diagrams separate from object diagrams to maintain clarity.
- Ignoring Multiplicity: Failing to specify how many objects are linked. Solution: Always define multiplicity on link ends to clarify cardinality.
- Static Data in Dynamic Contexts: Object diagrams are static. They do not show the flow of messages. Solution: Use sequence diagrams to complement object diagrams for behavior.
Best Practices for Clear Modeling ✅
To ensure the diagrams remain useful over time, follow these guidelines. These practices enhance the maintainability and clarity of the documentation.
- Use Meaningful Names: Object names should reflect their role, not just generic IDs. Use names like Order_2023_001 instead of Order_Instance_1.
- Limit Attribute Visibility: Do not list every possible attribute. Only show attributes relevant to the specific scenario being modeled.
- Group Related Objects: Place objects that interact frequently close to each other. This reduces the length of connecting lines.
- Review Regularly: As the system evolves, object diagrams may become outdated. Schedule periodic reviews to ensure they match the current system state.
- Document Context: Include a brief description or caption explaining the scenario the diagram represents. This helps future readers understand the snapshot.
Integration with Other UML Diagrams 📚
An object diagram does not exist in a vacuum. It works in tandem with other UML diagrams to provide a complete picture of the system.
Class Diagrams
The class diagram is the parent model. Every object in an object diagram must correspond to a class in the class diagram. If an object appears in the object diagram but has no corresponding class, the model is invalid.
Sequence Diagrams
Sequence diagrams show the flow of messages over time. Object diagrams can serve as the initial state for a sequence diagram. They define the objects that will participate in the interaction.
State Machine Diagrams
While state diagrams focus on behavior, the objects within the states can be represented using object diagram syntax. This helps clarify which instances change state.
Conclusion
UML object diagrams provide a necessary level of granularity for system design. By moving beyond abstract types to concrete instances, architects and developers gain insight into the actual data structure and relationships. When used correctly, they serve as a bridge between design theory and implementation reality. The key lies in maintaining clarity, adhering to standards, and recognizing when the snapshot view adds value to the overall documentation.
As you continue to refine your modeling skills, remember that the goal is communication. A diagram that is difficult to read fails its purpose. Focus on clean lines, consistent notation, and meaningful labels. With practice, these diagrams become powerful tools for ensuring system integrity and reducing ambiguity in complex software projects.