


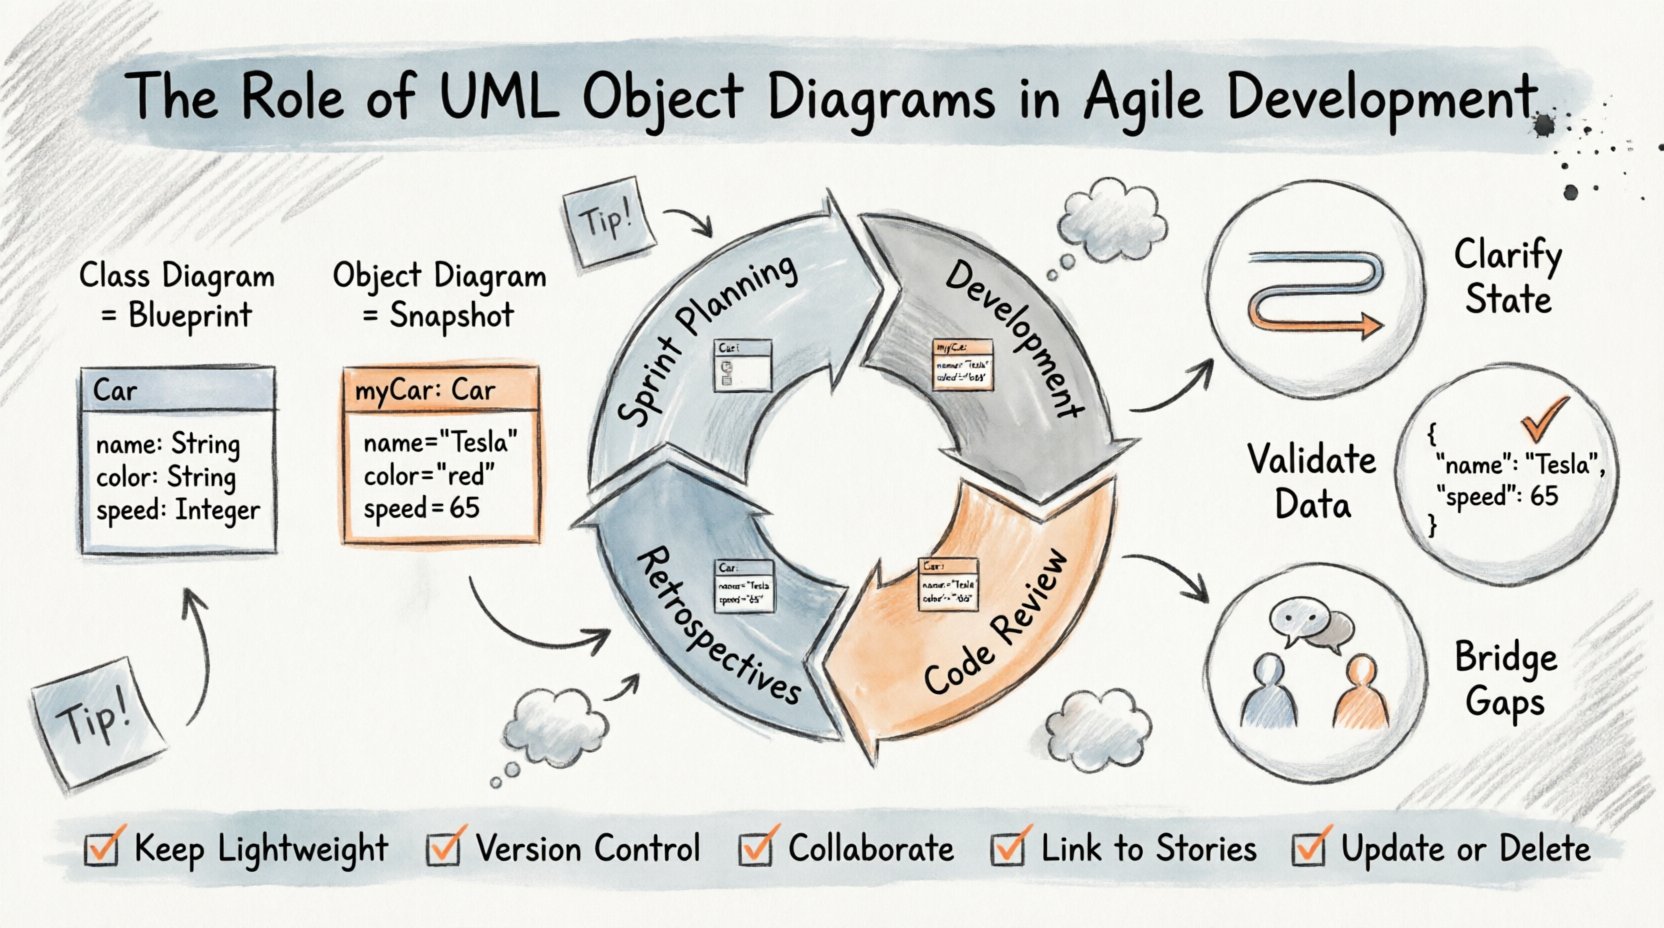
Agile development prioritizes individuals and interactions over processes and tools. However, effective communication often requires a shared visual language. While user stories and acceptance criteria drive the backlog, complex system behaviors can become opaque without structural visualization. This is where the UML Object Diagram plays a critical role. Unlike Class Diagrams that define blueprints, Object Diagrams capture snapshots of actual instances at a specific moment in time. Understanding this distinction is vital for teams navigating the iterative nature of modern software delivery.
In this guide, we explore how Object Diagrams fit into the Agile lifecycle. We examine their utility in clarifying state, validating data models, and bridging the gap between abstract requirements and concrete implementation. We will not focus on hype or quick fixes. Instead, we look at practical applications that reduce ambiguity and improve code quality.
🔍 What Is an UML Object Diagram?
To understand the value, one must first define the artifact. An Object Diagram is a structural diagram that shows a complete or partial view of the structure of a system at a specific moment in time. It is essentially a snapshot of the runtime state.
- Instances: It depicts specific objects, not just classes. For example, while a Class Diagram defines what a
Customeris, an Object Diagram showsCustomer_1with specific values likename = "Alice". - Links: It illustrates the relationships between these specific instances. These links represent associations, aggregations, or compositions existing in memory during execution.
- State: It captures the state of attributes at a point of observation. This is crucial for debugging and understanding data flow.
Many teams conflate Object Diagrams with Class Diagrams. While Class Diagrams describe the static structure (the template), Object Diagrams describe the dynamic reality (the data). In Agile, where changes happen rapidly, understanding the data state is often more immediate than understanding the schema definition.
⚙️ The Agile Context: Why Visualize Instances?
Agile methodologies emphasize iterative delivery and responding to change. Documentation often suffers in this environment, viewed as overhead. However, certain types of documentation act as anchors for stability. Object Diagrams serve this purpose by grounding abstract logic in concrete examples.
1. Clarifying Complex State Transitions
User stories often describe behaviors. “When a user clicks pay, the order status changes to completed.” This logic can be linear, but it often involves multiple objects interacting simultaneously.
- A
Paymentobject links to anOrderobject. - An
Invoiceobject might be generated. - A
Notificationobject is queued.
Drawing the Class Diagram shows these classes exist. Drawing the Object Diagram shows them connected *now*. This helps developers visualize the scope of a change. If the Payment object changes, which other instances are affected?
2. Validating Data Models During Sprint Planning
During planning sessions, stakeholders discuss data requirements. Developers often ask, “What data do we need?” The Object Diagram provides a template for this discussion.
Instead of saying “We need a user,” a team can sketch a diagram showing a User object with properties like email, role, and subscription_status. This forces specificity early, reducing the need for refactoring later.
3. Bridging Technical and Non-Technical Gaps
Class names can be jargon-heavy. Object instances often mirror real-world entities. A diagram showing a specific Customer with a Cart and Items is easier for a Product Owner to understand than a structural schema diagram. This shared understanding accelerates decision-making.
📅 Integration with Agile Ceremonies
Object Diagrams are not just for design phases. They integrate into the rhythm of the sprint.
Sprint Planning
When estimating complexity, developers look at the number of dependencies. An Object Diagram helps visualize these dependencies visually.
- Scope: Identify which objects must be created or modified.
- Dependencies: See how many external objects a new feature touches.
- Estimation: A feature touching five linked objects takes longer than one touching a single object.
Development & Pair Programming
During coding, diagrams act as a reference. When two developers pair up, a quick sketch of the current object state can resolve debates about data flow. It ensures both parties agree on what exists in memory.
Code Review
Reviewers can compare the implemented code against the Object Diagram. If the diagram shows a link between Order and Inventory, but the code lacks the association logic, the review catches the gap. This acts as a sanity check for data integrity.
Retrospectives
When issues arise, Object Diagrams help trace the path of failure. If data is lost, the diagram shows where the link broke. This aids in root cause analysis without needing to search through logs immediately.
🆚 Object Diagrams vs. Class Diagrams
It is common to wonder when to use which. The following table outlines the distinctions.
| Feature | Class Diagram | Object Diagram |
|---|---|---|
| Focus | Static Structure (Blueprint) | Dynamic State (Snapshot) |
| Entities | Classes (e.g., Car) |
Instances (e.g., myCar) |
| Values | Attributes defined, no values | Specific values present |
| Lifespan | Exists as long as code exists | Exists only during execution |
| Use Case | Architecture design | Debugging, specific scenario analysis |
| Agile Value | High-level roadmap | Concrete validation of requirements |
🛠 Practical Applications in Sprints
Applying this modeling technique requires discipline. It is not about drawing every diagram for every story. It is about selecting high-value scenarios.
Scenario 1: API Contract Validation
When building APIs, the input and output data structures are critical. An Object Diagram can represent the JSON payload structure.
- Input: Show the expected
Requestobject and its nestedUserobject. - Output: Show the
Responseobject and error handling objects.
This ensures that the frontend and backend agree on the shape of data before a single line of code is written. It reduces integration friction.
Scenario 2: State Machine Representation
Business logic often involves states. An Order might be Pending, Shipped, or Delivered. An Object Diagram can show an instance in the Shipped state and what objects it is linked to.
- Does a
Shippedorder allow cancellations? - Does it link to a
TrackingNumberobject?
Visualizing the state prevents logic errors where code assumes an object is in a state it is not.
Scenario 3: Database Schema Verification
While not a direct replacement for Entity-Relationship Diagrams, Object Diagrams verify how data relates in practice. A Class Diagram might show a one-to-many relationship. An Object Diagram shows if that relationship is actually populated or optional in the specific context.
⚠️ Common Pitfalls and Anti-Patterns
Even with good intentions, modeling can go wrong. Teams often fall into traps that reduce productivity.
- Over-Modeling: Creating diagrams for every single story creates maintenance debt. Agile moves fast; diagrams must move faster. If the diagram is not updated, it becomes a lie.
- Static Documentation: Storing diagrams in a wiki that no one opens is worse than not having them. They must be part of the active workflow.
- Ignoring the Code: The code is the source of truth. If the diagram contradicts the code, the diagram is wrong. Do not use diagrams to enforce code that does not exist.
- Lack of Abstraction: Trying to diagram the entire system at once is impossible. Focus on the specific scope of the current sprint.
🔧 Best Practices for Implementation
To maximize value, follow these guidelines.
1. Keep it Lightweight
Use simple tools. Whiteboards, sticky notes, or lightweight digital tools are sufficient. Do not invest in heavy enterprise modeling software if the goal is speed.
2. Version Control
Treat diagrams like code. Store them in the repository. If a diagram changes significantly, commit the change. This allows teams to see how the understanding of the system evolved over time.
3. Collaborative Drawing
Do not let one architect draw the diagram alone. Involve developers, testers, and product owners. The act of drawing together clarifies misunderstandings immediately.
4. Tie to Acceptance Criteria
Link the diagram to the User Story acceptance criteria. If a story requires a specific object state, the diagram should reflect that state. This ensures the work is measurable.
5. Update or Delete
If a feature is deprecated, delete the diagram. Do not leave orphaned models. This keeps the knowledge base clean and relevant.
🔄 Maintenance and Long-Term Value
One concern is the cost of maintaining diagrams. In a long-lived project, the value of documentation grows as team turnover occurs.
- Onboarding: New developers can look at Object Diagrams to understand data relationships without reading thousands of lines of code.
- Refactoring: When refactoring, the diagram helps identify which objects are safe to change and which are deeply coupled.
- Knowledge Retention: If a senior developer leaves, their understanding of the data structure is captured in the diagrams.
However, this value is only realized if the diagrams are accurate. Automated tools that generate diagrams from code can help, but they often miss the semantic context. A hybrid approach is best: use code to generate the skeleton, and use human input to define the specific relationships and states.
📈 Impact on Quality and Velocity
Does this actually improve velocity? The answer is nuanced. Initially, it slows you down. You spend time drawing instead of coding. However, over a sprint or a quarter, the time saved in debugging and rework outweighs the initial cost.
- Reduced Bugs: Many bugs are state-related. Visualizing state prevents these.
- Fewer Meetings: Misunderstandings often lead to long meetings. A diagram resolves them in seconds.
- Better Testing: Testers can see all possible object states and ensure coverage for each.
🚀 Summary of Benefits
Object Diagrams offer a specific lens into the Agile process. They do not replace code, tests, or stories. They complement them.
- Clarity: They make the invisible visible.
- Communication: They provide a common language for diverse roles.
- Validation: They ensure the data model matches the requirements.
- Maintenance: They serve as historical records of system evolution.
When used selectively and maintained rigorously, they become a powerful asset. They help teams move from “we think this is how it works” to “we know this is how it works.” In the complex world of software, knowing is better than guessing.
📝 Final Thoughts on Modeling
Modeling is a tool, not a goal. The goal is working software. If an Object Diagram helps you write better software, keep it. If it becomes a burden, discard it. Agile is about pragmatism. Use the diagram to solve problems, not to create paperwork. The most effective diagrams are those that are drawn, discussed, and then either integrated into the codebase or retired.
By focusing on the instances and the state, teams gain a deeper understanding of the data flow. This understanding reduces friction in the development pipeline. It allows for faster iteration because the team is aligned on the data structure. As the system grows, the complexity grows. Object Diagrams help manage that complexity without adding unnecessary overhead.