


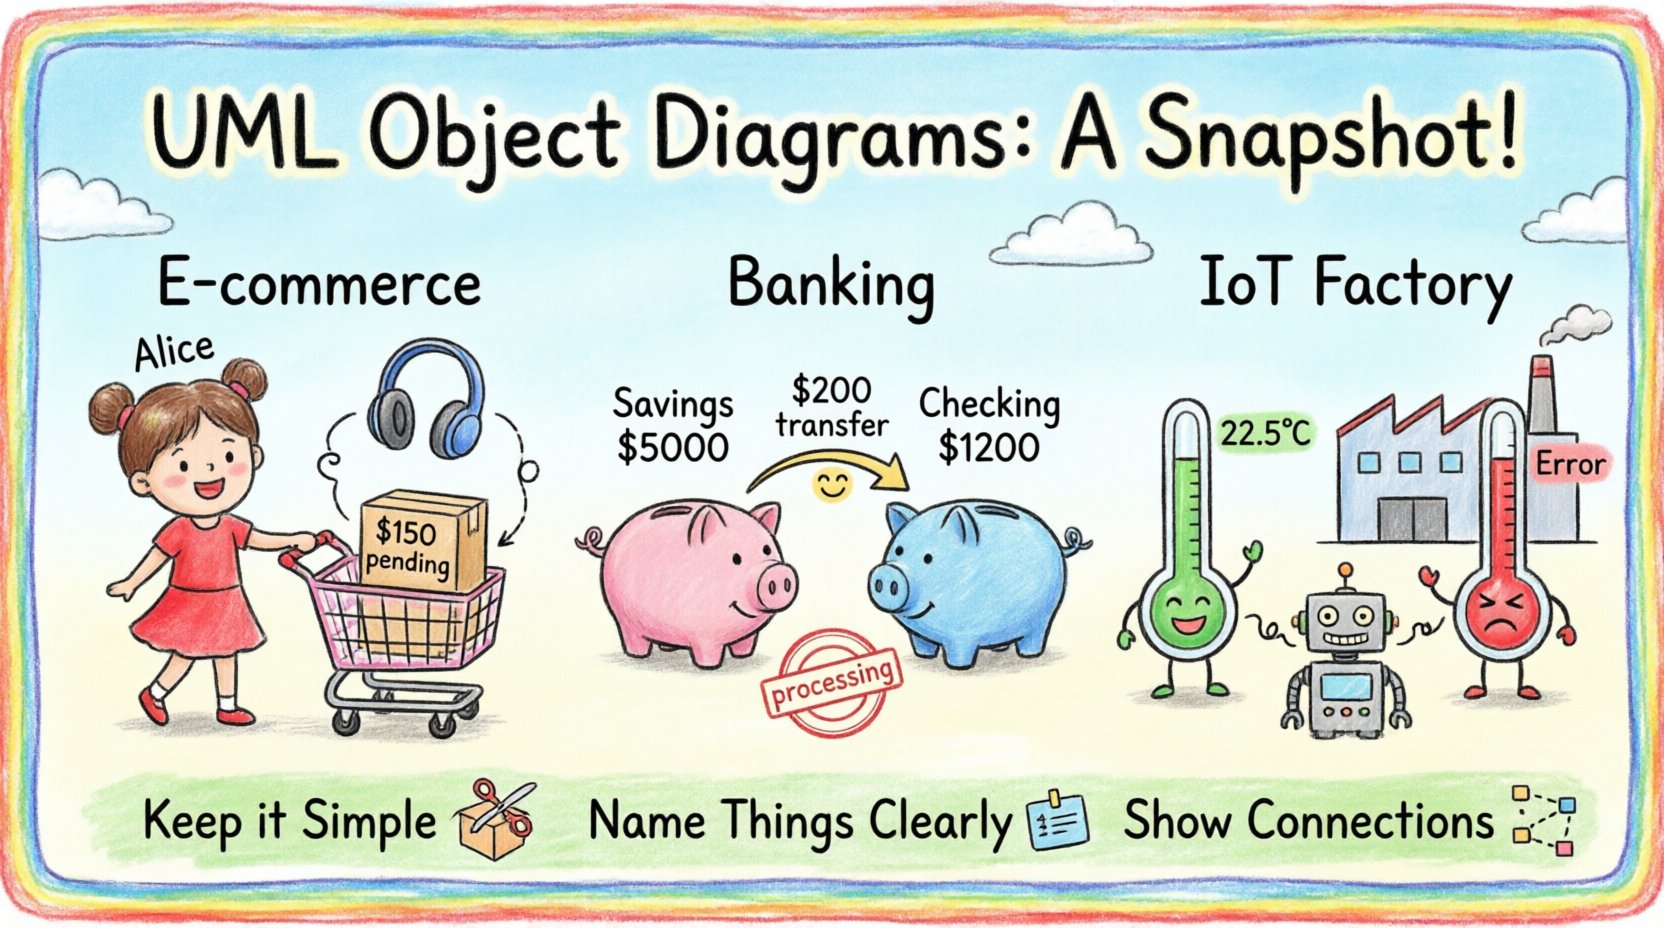
Software architecture relies heavily on visual communication. While class diagrams define the blueprint, object diagrams capture the specific state of a system at a precise moment. This distinction is vital for debugging, documentation, and understanding data flow in complex environments. In this guide, we explore practical applications through detailed case studies. We will examine how these diagrams function in e-commerce, banking, and IoT scenarios. The focus remains on the static structure of instances and their relationships, providing a clear view of runtime behavior.
🔍 Understanding the Core Concept
Before diving into specific scenarios, it is essential to establish what an object diagram represents. Unlike a class diagram, which defines types and general rules, an object diagram displays actual instances. Think of it as a photograph of the system. Every box in the diagram represents a specific object with defined attribute values.
These diagrams are particularly useful when analyzing:
- Runtime State: What data exists at a specific point in time?
- Relationships: How do specific instances link to one another?
- Constraints: Are the multiplicities and roles valid in this snapshot?
When modeling, we must distinguish between the class (the template) and the object (the instance). An object diagram helps visualize how the template is instantiated in reality. This clarity prevents ambiguity during the implementation phase.
📊 Case Study 1: E-Commerce Shopping Cart
Consider an online retail platform. The core functionality involves customers selecting items and placing orders. A class diagram would define the Customer, Order, and Product classes. However, an object diagram reveals the specific transaction state.
Scenario Overview
A customer logs in, adds items to a cart, and initiates checkout. The system must validate stock levels and calculate totals. An object diagram at the moment of checkout capture is crucial for auditing and debugging.
Key Instances
- Customer Instance:
cust_1024- name: “Alice Smith”
- email: “[email protected]”
- status: “verified”
- Order Instance:
ord_5591- orderDate: “2023-10-27”
- totalAmount: 150.00
- status: “pending_payment”
- Product Instance:
prod_8821- title: “Wireless Headphones”
- price: 120.00
- stock: 50
Relationships and Links
In this snapshot, specific links connect the instances. The cust_1024 object has a link to ord_5591. The ord_5591 object has a link to prod_8821. These links represent the navigation paths available in the code. The multiplicity on these links dictates how many objects can be connected.
For example, a single order might contain multiple products. In this specific diagram instance, we see a one-to-many relationship. One order object links to three product objects. This visual representation allows developers to trace the data flow without executing the code.
Why This Matters
When a dispute arises regarding a charge, the object diagram serves as a reference for the data state at the time of the transaction. It answers the question: “What was in the cart when the button was clicked?” This is invaluable for legal compliance and customer support.
🏦 Case Study 2: Banking Transaction System
Financial systems require high precision. An object diagram in this context focuses on the integrity of funds and the status of transactions. We will look at a snapshot during a transfer process.
Scenario Overview
A user transfers funds from a savings account to a checking account. The system must ensure atomicity: either both accounts update, or neither does. The diagram captures the state before the transaction commits.
Key Instances
- Account Instance (Savings):
acc_sav_001- accountNumber: “123456789”
- balance: 5000.00
- type: “savings”
- Account Instance (Checking):
acc_chk_002- accountNumber: “987654321”
- balance: 1200.00
- type: “checking”
- Transaction Instance:
txn_9988- amount: 200.00
- timestamp: “2023-10-27 10:00:00”
- status: “processing”
Comparative Analysis
| Feature | Class Diagram | Object Diagram |
|---|---|---|
| Content | Defines structure | Defines state |
| Attribute Values | Types only | Specific values |
| Use Case | Design phase | Debugging & Review |
| Time Sensitivity | Static | Snapshot in time |
Looking at the links, the txn_9988 object links to both account objects. This indicates the source and destination. The diagram makes it immediately obvious that the transaction involves two distinct entities. If a developer sees a link missing in a diagram of a failed transaction, they can identify the broken connection point.
Implications for Security
Security auditing often requires proving that a transaction was valid. An object diagram of the “before” and “after” states provides a clear audit trail. It demonstrates that the balance was sufficient and the link between the user and the account was active. This visual evidence supports technical reviews without revealing sensitive source code.
📡 Case Study 3: IoT Sensor Network
The Internet of Things (IoT) introduces complexity through volume and connectivity. Devices send data to gateways, which process it and store it. An object diagram here models the active connections and data points.
Scenario Overview
A smart factory uses temperature sensors. These sensors report to a central gateway. If a sensor fails, the gateway must log the error. We examine a snapshot where one sensor is malfunctioning.
Key Instances
- Gateway Instance:
gw_main_01- location: “Factory Floor A”
- status: “online”
- Sensor Instance (Normal):
sensor_temp_05- reading: 22.5°C
- lastUpdate: “10:05:00”
- Sensor Instance (Error):
sensor_temp_06- reading: “Error”
- lastUpdate: “10:04:55”
Connection Topology
The diagram shows the physical or logical links. The gw_main_01 connects to sensor_temp_05 and sensor_temp_06. The link to sensor_temp_06 might have a specific property indicating “error”. This visual cue helps network administrators locate issues quickly.
Data Flow Visualization
In IoT, data flows are critical. The object diagram highlights which devices are currently communicating. It can reveal if a device has disconnected unexpectedly. By comparing this diagram to a theoretical model, engineers can spot anomalies.
⚙️ Best Practices for Modeling
Creating effective object diagrams requires discipline. Here are strategies to ensure clarity and utility.
1. Limit the Scope
An object diagram should not depict the entire system. It is too large. Focus on a specific scenario or workflow. For example, model only the “Checkout” process, not the entire store inventory. This keeps the diagram readable.
2. Use Clear Naming
Instance names should be unique and descriptive. Instead of obj_1, use order_pending_001. This makes the diagram self-documenting. When reading the diagram, the name should convey the object’s purpose.
3. Maintain Multiplicity Accuracy
Ensure the links match the class definitions. If a class allows one-to-many, the object diagram must reflect that. If the diagram shows many-to-one where it should be one-to-one, it indicates a design error. Consistency between class and object models is paramount.
4. Capture State Explicitly
Attribute values are the main differentiator. Include relevant data. If a field like isLocked is false, show it. If it is true, show it. This distinction helps in understanding the system’s behavior without running the software.
🚫 Common Pitfalls to Avoid
Even experienced architects make mistakes. Recognizing these errors early saves time.
- Over-complication: Trying to show every object in the system. This creates a mess. Stick to the relevant subset.
- Ignoring Time: Forgetting that object diagrams represent a snapshot. Mixing states from different times creates confusion.
- Missing Links: Forgetting to draw the connections between objects. The relationships are often more important than the objects themselves.
- Static Values: Treating dynamic data as static. Ensure the values reflect the current state accurately.
🛠️ When to Use vs. When Not To
Not every situation requires an object diagram. Use your judgment.
Use When:
- Debugging: You need to trace a specific error path.
- Documentation: You need to explain the data state to a client.
- Testing: You are writing unit tests and need to know the expected object state.
- Review: You are conducting a code review and need to verify logic.
Do Not Use When:
- High-Level Design: For initial architecture, a class diagram is better.
- Flow Control: For logic flow, use activity or sequence diagrams.
- Large Scale Systems: If the object count is in the thousands, the diagram becomes unreadable.
📝 Final Considerations
Object diagrams are a powerful tool in the architect’s toolkit. They bridge the gap between abstract design and concrete reality. By studying real-world examples, we see their value in e-commerce, finance, and technology.
Remember that these diagrams are snapshots. They change as the system evolves. Keep them updated to remain useful. Use them to communicate complex states clearly. Avoid unnecessary complexity. Focus on the relationships that matter most to your specific problem.
With practice, you will find these diagrams invaluable for maintaining system integrity. They provide a static view of dynamic processes, offering clarity where words often fail. Apply these principles to your next project for better outcomes.