


Understanding software architecture requires a clear vision of how data exists at a specific moment. The Unified Modeling Language (UML) provides various tools for this, but the UML Object Diagram often gets overshadowed by its more famous cousin, the Class Diagram. Many practitioners treat it as optional or confuse it with other visual representations. This guide delves into the specifics of object modeling, separating established engineering practices from common misconceptions.
What Exactly Is an Object Diagram? 📊
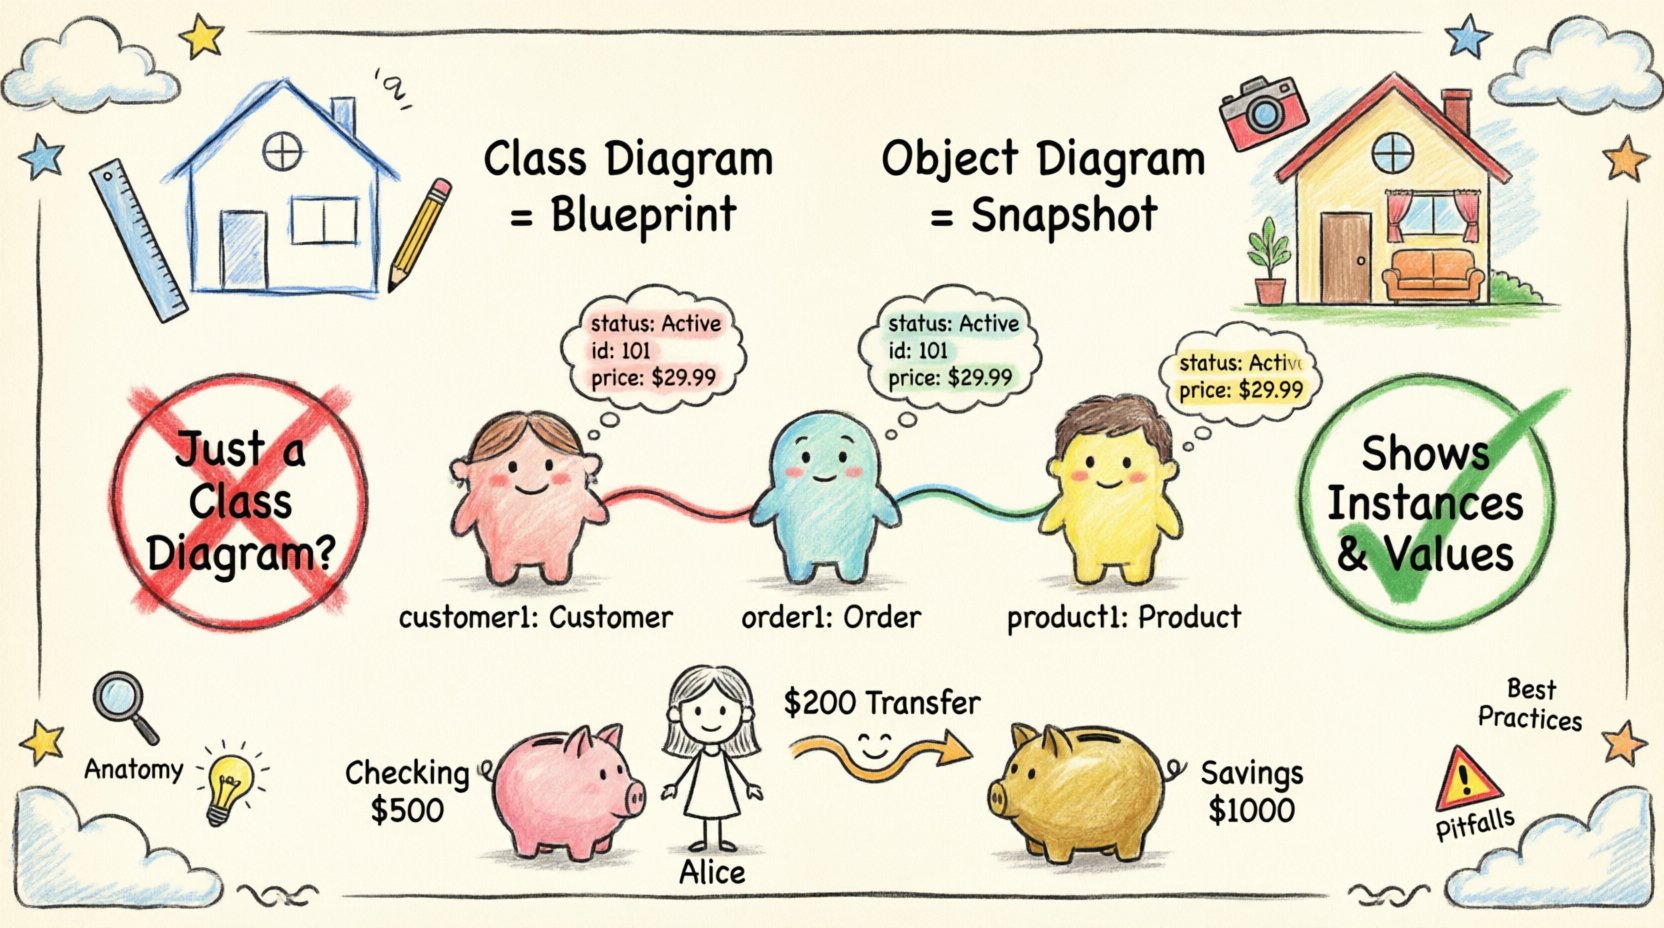
An object diagram represents a snapshot of the system at a specific point in time. While a class diagram defines the blueprint—the rules, types, and potential relationships—an object diagram shows the actual data populated according to those rules. Think of the class diagram as the architectural plan for a building, and the object diagram as a photograph of the building after it has been constructed and furnished.
- Static Representation: It does not show time or sequence. It shows state.
- Instances: It focuses on specific instances of classes, not the classes themselves.
- Links: It depicts the connections between these specific instances.
- Values: It can display the actual attribute values assigned to instances.
This distinction is critical. If you are designing a system where the structure of data is complex, having a clear view of the instance relationships helps prevent logic errors during implementation.
The Anatomy of an Object Diagram 🔍
To work effectively with these diagrams, one must understand the standard notation. Every element serves a purpose, and deviations can lead to confusion among team members.
- Object Names: Written in bold or italicized font, often prefixed with the class name (e.g.,
customer: Customer). Some notations omit the class name if context is clear. - Attribute Values: Listed within the object box, showing current state (e.g.,
status: Active). - Links: Lines connecting objects. These correspond to associations in the class diagram.
- Multiplicity: Indicates how many instances can be linked (e.g., 1..*, 0..1).
- Navigation: Arrows on links showing the direction of reference.
Common Myths Debunked 🚫
There is significant noise in the industry regarding when and how to use these diagrams. Below, we address the most persistent myths.
Myth 1: It Is Just a Class Diagram Without the Class Boxes 🤔
This is false. A class diagram defines types. An object diagram defines instances. You cannot derive a valid object diagram simply by replacing class boxes with instance boxes if the underlying relationships are not validated against the class constraints. The object diagram must adhere to the cardinality and type constraints defined in the class model.
Myth 2: It Shows How the System Works (Behavior) ⚙️
Behavior belongs to Sequence Diagrams or State Machine Diagrams. An object diagram is purely structural. It shows what exists, not how it changes over time. If you need to show a method call or a state transition, do not use this diagram type.
Myth 3: You Need One for Every Scenario 🗂️
Creating an object diagram for every single use case leads to documentation bloat. These diagrams are best reserved for complex aggregation scenarios, serialization states, or debugging specific data integrity issues. Over-modeling leads to maintenance nightmares.
When to Use Object Diagrams vs. Class Diagrams 🆚
Choosing the right tool depends on the goal of the documentation. The following table clarifies the appropriate use cases.
| Feature | Class Diagram | Object Diagram |
|---|---|---|
| Focus | Structure and Types | Instances and Data |
| Time | Static (Blueprint) | Static (Snapshot) |
| Detail Level | Abstract (Attributes, Methods) | Concrete (Attribute Values) |
| Use Case | System Design, Architecture | Debugging, Data Validation, Serialization |
Deep Dive: Relationships and Multiplicity 🔗
The power of the object diagram lies in its ability to visualize complex multiplicity constraints. In a class diagram, you might see a 1..* relationship between a Library and a Book. In an object diagram, you must explicitly draw the links that satisfy this rule.
Consider a scenario where a User object owns multiple Order objects. The object diagram will show the specific order_1, order_2, and order_3 instances linked to the user_a instance. This visual confirmation helps developers verify that the code correctly handles one-to-many relationships.
Key Relationship Types
- Association: A general structural link. (e.g., A person drives a car).
- Aggregation: A whole-part relationship where the part can exist independently. (e.g., A Department has Employees).
- Composition: A strong whole-part relationship where the part cannot exist without the whole. (e.g., A House has Rooms).
- Dependency: A usage relationship. (e.g., A Class uses another Class).
Integration with Other Modeling Artifacts 📎
An object diagram does not exist in isolation. It interacts with other parts of the model to provide a complete picture of the software.
Relationship with Sequence Diagrams
Sequence diagrams show the flow of messages over time. Object diagrams can serve as the starting point for a sequence diagram. By defining the objects involved in the interaction, the object diagram ensures that the participants in the sequence diagram are valid instances of the system architecture.
Relationship with State Machine Diagrams
State machines describe the lifecycle of a single object. An object diagram can represent a specific state of that object. For example, if an Order object has a state machine, the object diagram can show the Order instance with the attribute status: Shipped.
Common Construction Pitfalls 🛑
Even experienced architects make mistakes when drawing these diagrams. Avoid the following common errors to maintain clarity.
- Inconsistent Naming: Mixing camelCase and snake_case for object names confuses readers. Stick to a single convention.
- Ignoring Multiplicity: Drawing a link that violates the cardinality defined in the class diagram (e.g., linking one-to-many as one-to-one).
- Overcrowding: Trying to show the entire database state in one diagram makes it unreadable. Focus on a specific cluster of objects.
- Missing Labels: Links should be labeled with the role names defined in the class diagram to clarify the direction of the relationship.
- Confusing Types and Instances: Do not label an object with just the class name. It must indicate it is an instance (e.g.,
instance: Type).
Best Practices for Implementation 🛠️
To ensure these diagrams remain useful assets rather than clutter, follow these guidelines.
1. Keep Them Updated
Outdated diagrams are worse than no diagrams. If the code changes the structure of the data, the object diagram must reflect that. Treat them as living documents tied to the codebase.
2. Use for Debugging
When a bug involves data structure (e.g., null pointer exceptions, circular references), draw the object diagram of the failing state. It often reveals the missing link or the unexpected value.
3. Define Clear Naming Conventions
- Instance Names: Use lowercase for the instance (e.g.,
customer1). - Type Names: Use uppercase for the class (e.g.,
Customer). - Link Names: Use the role name defined in the association (e.g.,
owns).
4. Validate Against Constraints
Before finalizing the diagram, verify that every link satisfies the multiplicity constraints. If the class diagram says a Manager must have at least one Subordinate, ensure the object diagram shows at least one link for every manager instance.
Technical Nuances: Serialization and Persistence 🗄️
One of the most practical applications of object diagrams is in understanding serialization. When data is saved to a database or sent over a network, the object graph is flattened. An object diagram helps visualize this graph.
Consider a ShoppingCart system. The cart holds items. Each item has a product. If you serialize this, the relationship between the cart and the product must be preserved. The object diagram makes it clear which references are transient and which are persistent. This is vital for database design and API contract definition.
Limitations and When to Avoid 📉
No modeling technique is perfect. Object diagrams have specific limitations that require awareness.
- No Behavior: As stated, they cannot show logic. Do not use them to explain algorithmic flow.
- Scalability Issues: A system with millions of objects cannot be represented. They are for design-time or specific runtime snapshots, not production scale visualization.
- Dynamic Creation: They struggle to show objects created dynamically at runtime unless you model the factory pattern explicitly.
- Versioning: If the schema changes frequently, maintaining the diagram becomes a high-cost activity with diminishing returns.
Case Study: Modeling a Banking Transaction 🏦
To illustrate the value, consider a banking system. We have a Account, a Transaction, and a User.
Using a Class Diagram, we define that a User has many Accounts. Using an Object Diagram, we can visualize a specific transaction state.
- Instance 1:
user_Alice(Type: User) - Instance 2:
acc_Checking(Type: Account, Balance: 500) - Instance 3:
acc_Savings(Type: Account, Balance: 1000) - Instance 4:
txn_Transfer1(Type: Transaction, Amount: 200)
The links show that txn_Transfer1 is linked to acc_Checking (Source) and acc_Savings (Destination). This visual snapshot confirms that the transaction logic correctly references two different accounts owned by the same user. It prevents errors where a transfer might incorrectly reference an unowned account.
Summary of Key Takeaways 📝
The UML Object Diagram is a specialized tool for structural validation. It is not a replacement for class diagrams, sequence diagrams, or state machines. Its value lies in verifying data integrity at a specific moment.
- Fact: It shows instances, not types.
- Fact: It is static, not dynamic.
- Fact: It validates multiplicity and links.
- Fiction: It is not the same as a class diagram.
- Fiction: It does not show behavior.
- Fiction: It is not always necessary for every project.
By understanding the specific role of this diagram, architects and developers can use it to prevent structural bugs and ensure that the data model aligns with the implementation. It is a tool for precision, not for general overview.
Final Thoughts on Model-Code Alignment 🔄
The ultimate goal of modeling is alignment between the design and the code. Object diagrams bridge the gap between abstract types and concrete data. When the code runs, the state of the system should match the object diagrams derived from the design. If they diverge, the code is likely flawed. Regular reviews of these snapshots against running systems help maintain high data quality and system reliability.
Remember, diagrams are communication tools. If a diagram confuses the reader, it has failed its purpose. Keep it simple, keep it accurate, and use it where the structural complexity demands it.