


Legacy systems often serve as the backbone for critical business operations. They contain decades of accumulated logic, data structures, and workflows. Over time, documentation becomes stale or disappears entirely. New team members face steep learning curves when attempting to understand these environments. Without clear visualizations, the complexity remains hidden within the code.
UML object diagrams provide a specific type of static view. Unlike class diagrams which show the blueprint, object diagrams display instances. This distinction is vital when analyzing existing systems. You are looking at a snapshot of the runtime environment. This perspective reveals how components interact at a specific moment in time. Understanding this snapshot helps in reverse engineering and maintenance.
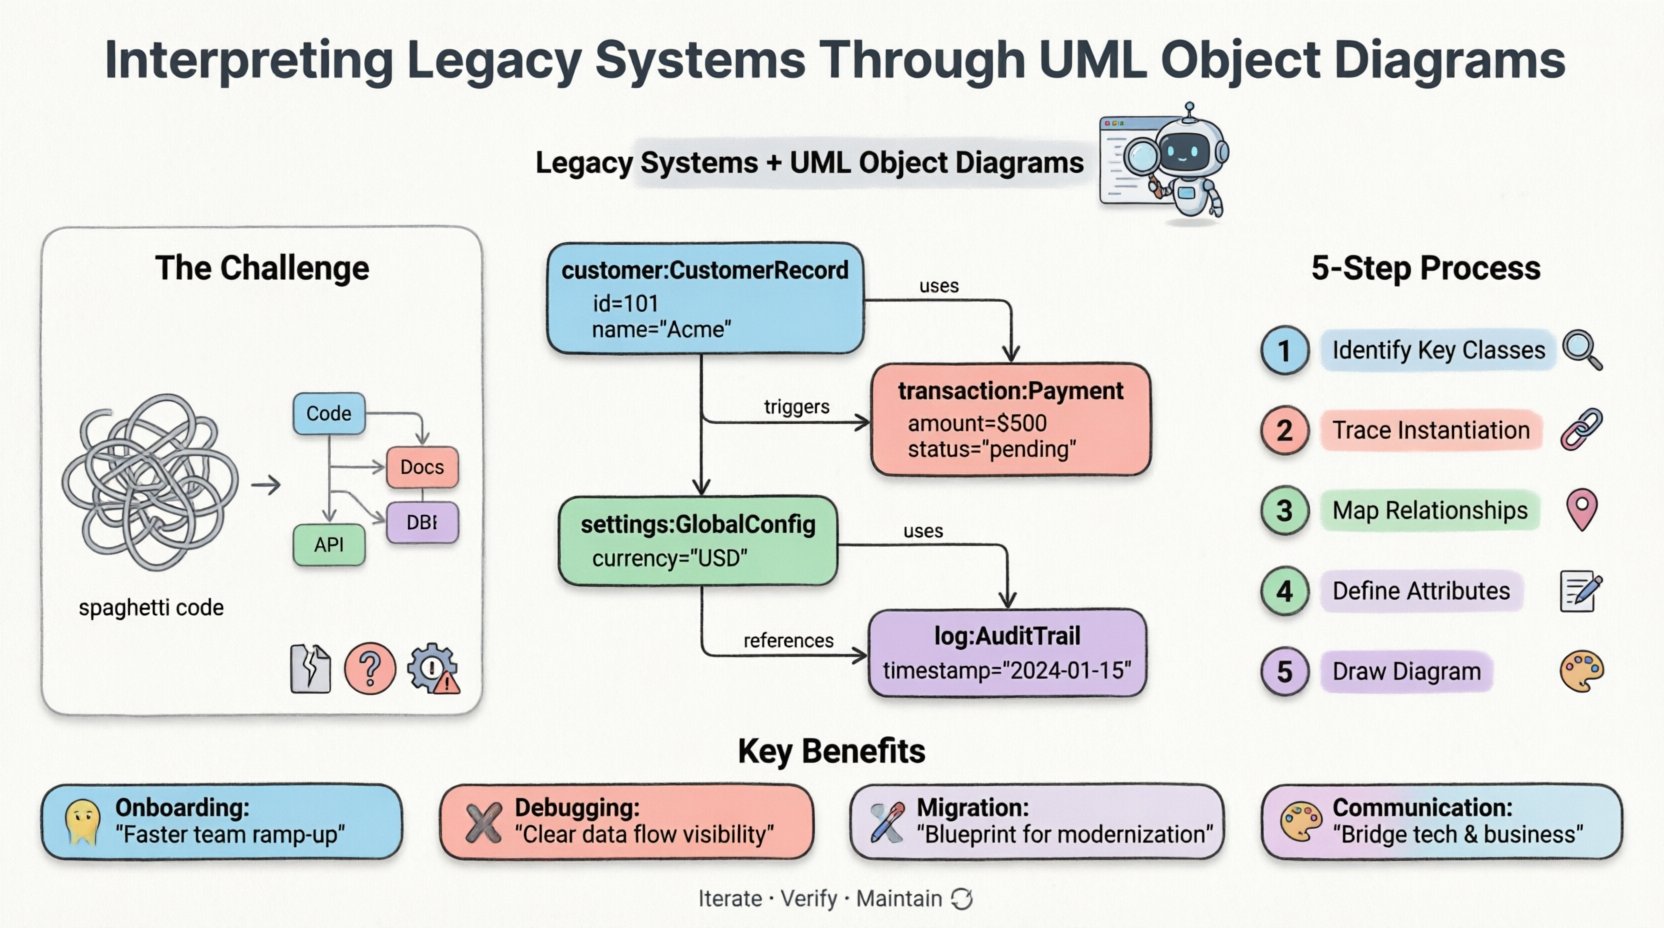
Understanding Object Diagrams in a Legacy Context 📊
Before diving into interpretation, it is necessary to define the tool. A UML object diagram is a static structure diagram. It shows a complete snapshot of the system at a given time. It consists of objects and the links between them. Each object represents an instance of a class. The links represent relationships such as associations or aggregations.
Why choose this over a class diagram for legacy work? Class diagrams describe potential structures. Object diagrams describe actual usage. In a legacy system, the actual usage often differs from the original design. Features are added, and connections are forged over years. An object diagram captures the reality of the current state.
Key Components of an Object Diagram
- Instances: These are the specific objects. They are named with a colon and the class name. For example,
customer:CustomerRecord. - Attributes: You can show the current values of attributes. This is useful for debugging data flow issues.
- Links: These connect instances. They represent the relationships active at runtime.
- Multiplicity: This defines how many objects can be linked. It helps in understanding one-to-many or many-to-many scenarios.
The Challenge of Legacy Systems 🏗️
Maintaining old software introduces specific difficulties. The original architects may no longer be available. The technology stack might be obsolete. Business requirements have shifted since the code was written. These factors create a fog around the system’s architecture.
Common Issues in Legacy Environments
- Spaghetti Code: Logic is often intertwined. Dependencies are hard to trace without a map.
- Hidden State: Global variables and static fields create state that is not obvious in the code structure.
- Documentation Gaps: Requirements documents are lost. Comments in code are outdated.
- Refactoring Risks: Changing code without understanding side effects can break critical functions.
When you attempt to modify these systems, the risk of regression increases. Visualizing the structure helps mitigate this risk. Object diagrams act as a safety net. They allow you to see the impact of a change before applying it.
Bridging the Gap: Why Object Diagrams Matter 🔗
Transitioning from code to visualization requires a systematic approach. Object diagrams fill the gap between abstract code and concrete business logic. They translate technical implementation into understandable models.
Benefits of Visualization
- Onboarding: New engineers can grasp the system faster with a visual map.
- Debugging: Identifying where data flows incorrectly becomes easier.
- Migration: When moving to a new platform, the object diagram serves as a target specification.
- Communication: Stakeholders can understand the system structure without reading code.
These benefits extend beyond simple documentation. They influence decision-making processes. Management can see the technical debt more clearly. Resource allocation becomes more accurate. The diagram provides a common language for developers and business analysts.
Methodology for Analysis and Creation 🛠️
Creating these diagrams from a legacy codebase is a process. It requires patience and attention to detail. There is no single tool that does this perfectly. Manual analysis combined with automated extraction yields the best results.
Step-by-Step Interpretation Process
- Identify Key Classes: Scan the codebase for the most critical entities. These are usually the core business objects.
- Trace Instantiation: Find where these classes are instantiated. This reveals the active instances.
- Map Relationships: Determine how these instances connect. Look for method calls that pass objects between components.
- Define Attributes: Note the significant data stored in these objects. Ignore minor configuration details.
- Draw the Diagram: Arrange the objects to show the flow. Use links to denote dependencies.
This process is iterative. You will likely need to refine the diagram as you discover more connections. It is not a one-time task. It evolves with the system.
Dealing with Dynamic Behavior
One limitation of object diagrams is that they are static. They do not show behavior over time. However, in legacy systems, understanding the static structure is often the first priority. Once the structure is clear, you can analyze the behavior separately.
To capture dynamic aspects, consider creating multiple object diagrams. Each diagram represents a different state or transaction. For example, one diagram for a login sequence and another for a payment processing sequence. This creates a composite view of the system’s behavior.
Common Patterns and Anti-Patterns 📋
Legacy systems often exhibit specific structural patterns. Recognizing these patterns helps in interpretation. Some patterns indicate good design, while others signal technical debt.
The following table outlines common scenarios found in older architectures.
| Pattern Type | Description | Implication |
|---|---|---|
| Singleton | Only one instance exists globally. | Hard to mock or test. Creates hidden state. |
| Dependency Injection | Objects are passed as parameters. | Good for separation of concerns. Easier to trace. |
| Circular Dependency | Object A calls Object B, which calls Object A. | Indicates tight coupling. High refactoring risk. |
| Global State | Objects share static variables. | Concurrency issues. Hard to predict behavior. |
| God Object | One object manages too many responsibilities. | Complexity bottleneck. Single point of failure. |
Managing Complexity in Large Systems 🧠
As systems grow, object diagrams become large and unwieldy. A single diagram covering the entire system is often impossible to read. You must adopt a strategy for managing scale.
Strategies for Scalability
- Partitioning: Break the system into logical domains. Create a diagram for each domain.
- Focus Areas: Draw diagrams only for the area you are currently working on.
- Abstraction: Hide internal details of complex objects. Show them as black boxes.
- Annotations: Use notes to explain complex relationships or constraints.
Partitioning is particularly effective. It allows different teams to work on different diagrams. It reduces cognitive load for the individual reader. It also facilitates parallel development and documentation efforts.
Documentation Standards and Maintenance 📝
Creating the diagram is only half the battle. Keeping it up to date is the real challenge. Legacy systems change frequently. A static document quickly becomes obsolete.
Best Practices for Sustainability
- Version Control: Store diagram files in the same repository as the code.
- Change Logs: Document every significant change to the model.
- Reviews: Include diagram updates in the code review process.
- Automation: Use scripts to extract data and update diagrams where possible.
Automating the update process reduces the burden. However, manual verification is still required. Automated tools can miss context. Human review ensures accuracy. This hybrid approach balances efficiency with correctness.
Integration with Modernization Efforts 🚀
Many organizations plan to modernize legacy systems. This involves moving to cloud platforms or new languages. The object diagram serves as a blueprint for this transition.
Planning the Transition
- Gap Analysis: Compare the legacy diagram with the target architecture.
- Data Mapping: Ensure data structures align between old and new systems.
- Interface Definition: Define how new components will interact with legacy ones.
- Risk Assessment: Identify areas with high coupling that need careful handling.
The diagram provides a baseline for comparison. It helps in identifying what needs to be rewritten and what can be retained. It prevents the “rip and replace” approach, which is often riskier than necessary.
Case Study: Analyzing a Financial Module 💰
Consider a financial module within a banking system. It handles transactions, balances, and audit logs. The original code was written ten years ago. The team needs to add a new currency type.
Without a diagram, the team fears breaking existing calculations. They create an object diagram for the transaction flow. They discover a hidden dependency on a global currency constant. This constant is not obvious in the method signatures.
The diagram reveals that the Transaction object holds a reference to a GlobalSettings object. Changing the currency requires updating the settings object. The diagram also shows that the AuditLog is created before the transaction is finalized. This order is critical for compliance.
By following the links in the diagram, the team identifies all affected components. They test these components specifically. The risk of regression is minimized. The change is deployed safely. This illustrates the practical value of the diagram.
Final Considerations for Interpretation ⚖️
Interpreting legacy systems requires a disciplined approach. Object diagrams are a powerful tool in this process. They provide clarity in a confusing environment. They do not replace the need to read code. Instead, they guide where to look.
Success depends on accuracy. An incorrect diagram is worse than no diagram. It creates false confidence. Always verify the model against the actual code. Use the diagram as a hypothesis to test, not a final truth.
Summary of Key Takeaways
- Object diagrams show runtime instances, not just potential structures.
- Legacy systems benefit from visualization due to documentation gaps.
- Iterative creation is better than trying to capture everything at once.
- Patterns and anti-patterns can be identified through structural analysis.
- Maintenance of the diagram is as important as its creation.
Adopting this method improves the longevity of your systems. It reduces the fear associated with touching old code. It empowers teams to make informed decisions. The investment in documentation pays dividends in stability and speed.