


Software architecture relies on clear communication. When teams build complex systems, the gap between abstract design and concrete implementation often widens. This is where static structure modeling plays a critical role. Specifically, the UML Object Diagram provides a snapshot of the system at a specific moment in time. Unlike class diagrams, which define templates, object diagrams define actual instances. Integrating these diagrams into your development workflow ensures that the running system matches the intended design.
This guide explores the practical application of object diagrams. We will examine how to utilize them for debugging, database schema validation, and stakeholder communication. By treating these diagrams as living documents rather than static artifacts, teams can maintain a consistent understanding of data structures throughout the lifecycle.
🧩 Understanding the Core Concepts
To integrate a tool effectively, you must first understand its function. The Unified Modeling Language (UML) offers various diagram types. Among them, the object diagram is often overlooked in favor of class diagrams. However, it serves a unique purpose.
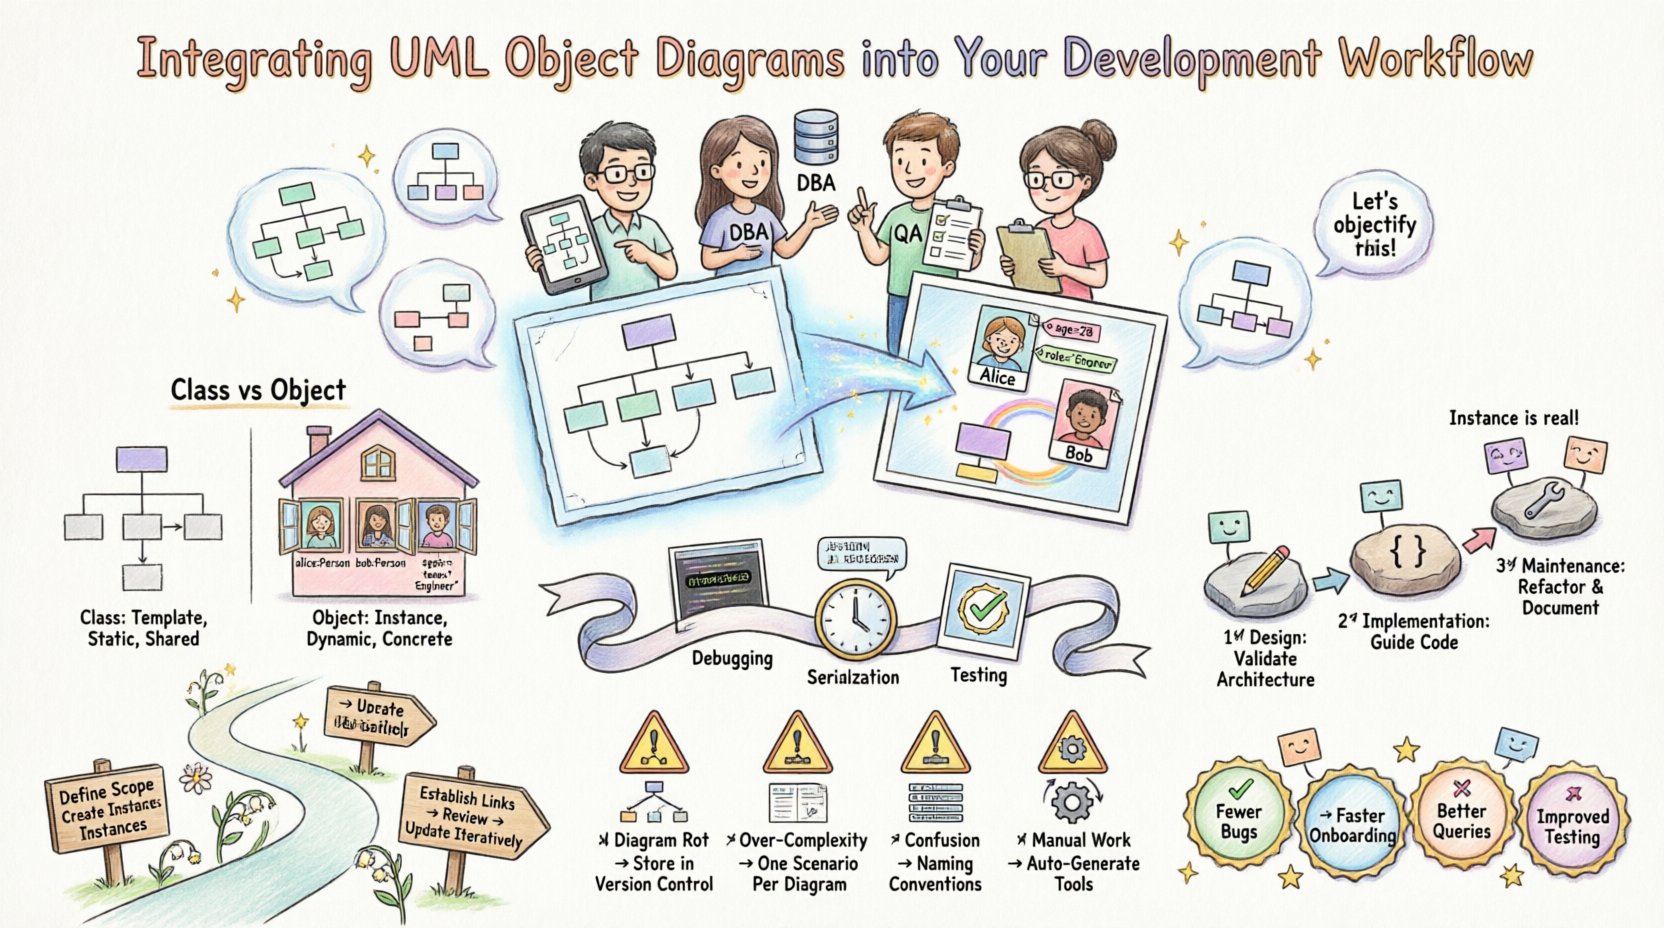
🏗️ Class vs. Object: The Distinction
Confusion between these two concepts is common. Here is the breakdown:
- Class Diagram: Represents the blueprint. It defines types, attributes, and methods. It describes what an object can do, not what it currently is.
- Object Diagram: Represents the blueprint in use. It shows specific instances, their current values, and the links between them at a specific point in time.
Consider a house. The class diagram is the architectural plan showing where doors and windows go. The object diagram is a photograph of a specific house under construction, showing exactly which rooms are painted and which windows are open right now.
⏳ The Temporal Aspect
Object diagrams capture a state. They are not permanent. As the system runs, data changes. An object diagram might be valid for a single function call, a database transaction, or a snapshot of the production environment. This temporal nature is crucial for:
- Debugging: Visualizing the state when an error occurs.
- Serialization: Understanding how data is persisted to disk.
- Testing: Verifying that mocked objects have the correct structure before execution.
🚀 Integrating into the Development Lifecycle
Integrating these diagrams requires a shift in process. They should not be created once and abandoned. Instead, they must align with the stages of development.
1️⃣ Design Phase: Validating Architecture
During the initial design, object diagrams help verify that the class structure allows for the necessary data relationships. Before writing code, sketch a scenario:
- What does a user session look like?
- How does a payment transaction link to an order?
- Are there circular dependencies that could cause infinite loops?
By drawing instances, you force yourself to think about data flow, not just class definitions. This often reveals missing attributes or incorrect relationship cardinalities early in the cycle.
2️⃣ Implementation Phase: Guiding Code
While coding, developers often focus on logic. Object diagrams remind them of the data shape. When creating a new module:
- Instantiation: Ensure the code creates instances consistent with the diagram.
- Linking: Verify that object references (pointers) match the associations defined in the design.
- Validation: Use the diagram as a checklist for unit tests. Does the test data match the expected instance structure?
3️⃣ Maintenance Phase: Documentation & Refactoring
Legacy code often lacks documentation. Object diagrams serve as a visual reference for how data is currently connected. When refactoring:
- Update the diagram to reflect the new structure.
- Identify deprecated instances that are no longer needed.
- Ensure database migrations align with the new instance shapes.
📊 Comparison of Diagram Usage
Deciding when to use an object diagram versus other UML types can be difficult. The following table clarifies the appropriate context for each diagram type.
| Diagram Type | Primary Focus | Best Used When… | Limitations |
|---|---|---|---|
| Class Diagram | Static Structure | Defining types and interfaces for the whole system. | Does not show current data values or specific instances. |
| Object Diagram | Dynamic State | Visualizing a specific scenario, snapshot, or error state. | High maintenance; changes frequently as data evolves. |
| Sequence Diagram | Behavior & Timing | Showing how objects interact over time through messages. | Does not clearly show the static state of the objects themselves. |
| State Machine Diagram | State Transitions | Defining how a single object changes states in response to events. | Does not show the relationship between multiple objects. |
🤝 Enhancing Collaboration with Stakeholders
Technical documentation often fails because it is too abstract. Object diagrams bridge the gap between technical teams and business stakeholders.
💡 For Database Administrators
DBAs need to know how data is stored. Object diagrams help map object instances to database tables. They clarify:
- Which objects are persistent and which are transient.
- How foreign keys relate to object references.
- The volume of data likely to exist per instance.
🛡️ For Quality Assurance
Testers need to know what valid data looks like. An object diagram provides a visual schema for test data generation. Instead of guessing field values, testers can see:
- The expected relationship between parent and child objects.
- Required attributes for a valid instance.
- Null handling and optional associations.
👔 For Project Managers
Managers need to understand scope. Object diagrams show the complexity of data relationships. This helps in:
- Estimating storage requirements.
- Understanding the impact of changing one object on others.
- Visualizing the “real-world” entities the software is managing.
🛠️ Step-by-Step Integration Process
Implementing this workflow requires discipline. Follow these steps to ensure diagrams add value rather than becoming overhead.
Step 1: Define the Scope
Do not attempt to diagram every object in the system. Select critical paths. Focus on:
- Complex business transactions.
- Core domain entities.
- Interfaces with external systems.
Step 2: Create the Instance Definitions
Draw the boxes representing instances. Label them clearly. The standard notation is:
- Instance Name: Often italicized (e.g., customer_01).
- Class Name: Below the instance name (e.g., Customer).
- Attributes: Listed within the box with current values (e.g., name: “John”).
Step 3: Establish Links
Draw lines connecting instances. These represent associations. Label the lines with role names if necessary. Ensure the multiplicity matches the class definition (e.g., one-to-many).
Step 4: Review and Validate
Conduct a review session. Ask the development team:
- Does this accurately reflect the current data model?
- Are there missing relationships?
- Is the data consistent with business rules?
Step 5: Update Iteratively
Integrate diagram updates into the pull request process. When a class changes, the object diagram should be updated if the instance structure changes. This keeps the documentation synchronized with the code.
⚠️ Common Pitfalls and How to Avoid Them
Even with a solid plan, teams often struggle. Here are common issues and solutions.
📉 Diagram Rot
Diagrams become outdated quickly. If the code changes but the diagram does not, trust is lost.
- Solution: Treat diagrams as code. Store them in version control. Review them during code reviews.
🧱 Over-Complexity
Trying to draw the entire system in one object diagram creates a mess. Object diagrams are for specific scenarios.
- Solution: Use multiple diagrams for different scenarios (e.g., “Checkout Process”, “User Login”, “Report Generation”).
🔄 Confusion with Class Diagrams
Developers sometimes draw class diagrams but label them as objects, or vice versa.
- Solution: Enforce naming conventions. Class names should be capitalized (e.g., Customer). Instance names should be lowercase or italicized (e.g., cust_123).
📝 Manual Maintenance
Hand-drawing or manually editing diagrams is prone to error and slow.
- Solution: Use tools that can generate diagrams from code or database schemas. Reverse engineering ensures accuracy.
🔍 Advanced Use Cases
Beyond basic design, object diagrams offer advanced utility in specific technical contexts.
📦 Serialization and Deserialization
When saving state to JSON, XML, or binary formats, the structure of the object graph matters. An object diagram helps visualize:
- Which properties are serialized.
- How nested objects are flattened.
- Potential circular references that could break parsers.
🧪 Mocking and Stubbing
In unit testing, developers create mock objects. An object diagram acts as a template for these mocks. It ensures that the test environment mimics the production environment’s data structure.
📉 Performance Analysis
Object diagrams can highlight potential performance bottlenecks.
- Memory Usage: A diagram showing millions of instances linked to a single parent object indicates high memory consumption.
- Garbage Collection: Complex reference cycles can prevent objects from being cleaned up. Visualizing links helps identify these cycles.
🔄 Lifecycle Management of Diagrams
To keep diagrams useful, they must be managed like software artifacts.
Creation
- Generate from the design specification.
- Ensure consistency with the class diagram.
Review
- Check against business requirements.
- Verify with the database schema.
Update
- Trigger updates when code changes affect data structure.
- Archive old versions for historical reference.
Deprecation
- Mark diagrams as obsolete when the feature is retired.
- Remove them from active documentation to reduce clutter.
📈 Measuring Success
How do you know if integrating object diagrams is working? Look for these indicators:
- Reduced Bug Reports: Fewer errors related to data structure mismatches.
- Faster Onboarding: New developers understand the data model faster using visual references.
- Improved Queries: Database queries are written more accurately because the relationships are clear.
- Better Testing: Test cases cover edge cases that were missed in abstract design.
🧭 Final Thoughts on Implementation
Integrating UML object diagrams into your workflow is not about creating paperwork. It is about clarifying the state of your system. When developers, testers, and architects share a visual understanding of data instances, communication becomes more efficient. Errors are caught earlier. The connection between code and design remains strong.
Start small. Pick one complex module. Draw the object diagram. Use it to guide your implementation. Review it during testing. If it helps, expand the practice. If it adds friction, adjust the process. The goal is clarity, not compliance. By treating these diagrams as essential communication tools, you build a more robust and maintainable software foundation.