


Unified Modeling Language (UML) provides a standardized way to visualize the design of a system. Within this framework, object diagrams serve a critical function by illustrating a specific snapshot of a system at a particular point in time. Unlike class diagrams which define the blueprint, object diagrams depict the actual instances. This guide provides a granular look at the symbols, notation, and structural elements required to create effective instance diagrams.
Understanding these diagrams is essential for software architects and developers who need to communicate runtime states or validate data integrity. By breaking down the visual language into its constituent parts, teams can ensure clarity across development lifecycles without relying on ambiguous verbal descriptions. The following sections detail the specific notation used in object modeling.
🔍 Core Components of an Object Diagram
Object diagrams are structurally similar to class diagrams but focus on instances rather than types. They represent the state of a system at a specific moment. The fundamental building blocks include objects, links, and attributes.
- Objects: Represented by rectangles containing the instance name and class name.
- Links: Represent connections between objects, mirroring associations between classes.
- Attributes: Show the current values of properties for a specific instance.
- Links: Solid lines connecting objects that indicate a relationship.
When constructing these diagrams, precision is key. An object name typically follows the format instanceName : ClassName. This distinction allows readers to immediately identify that the element is a concrete instance rather than an abstract type.
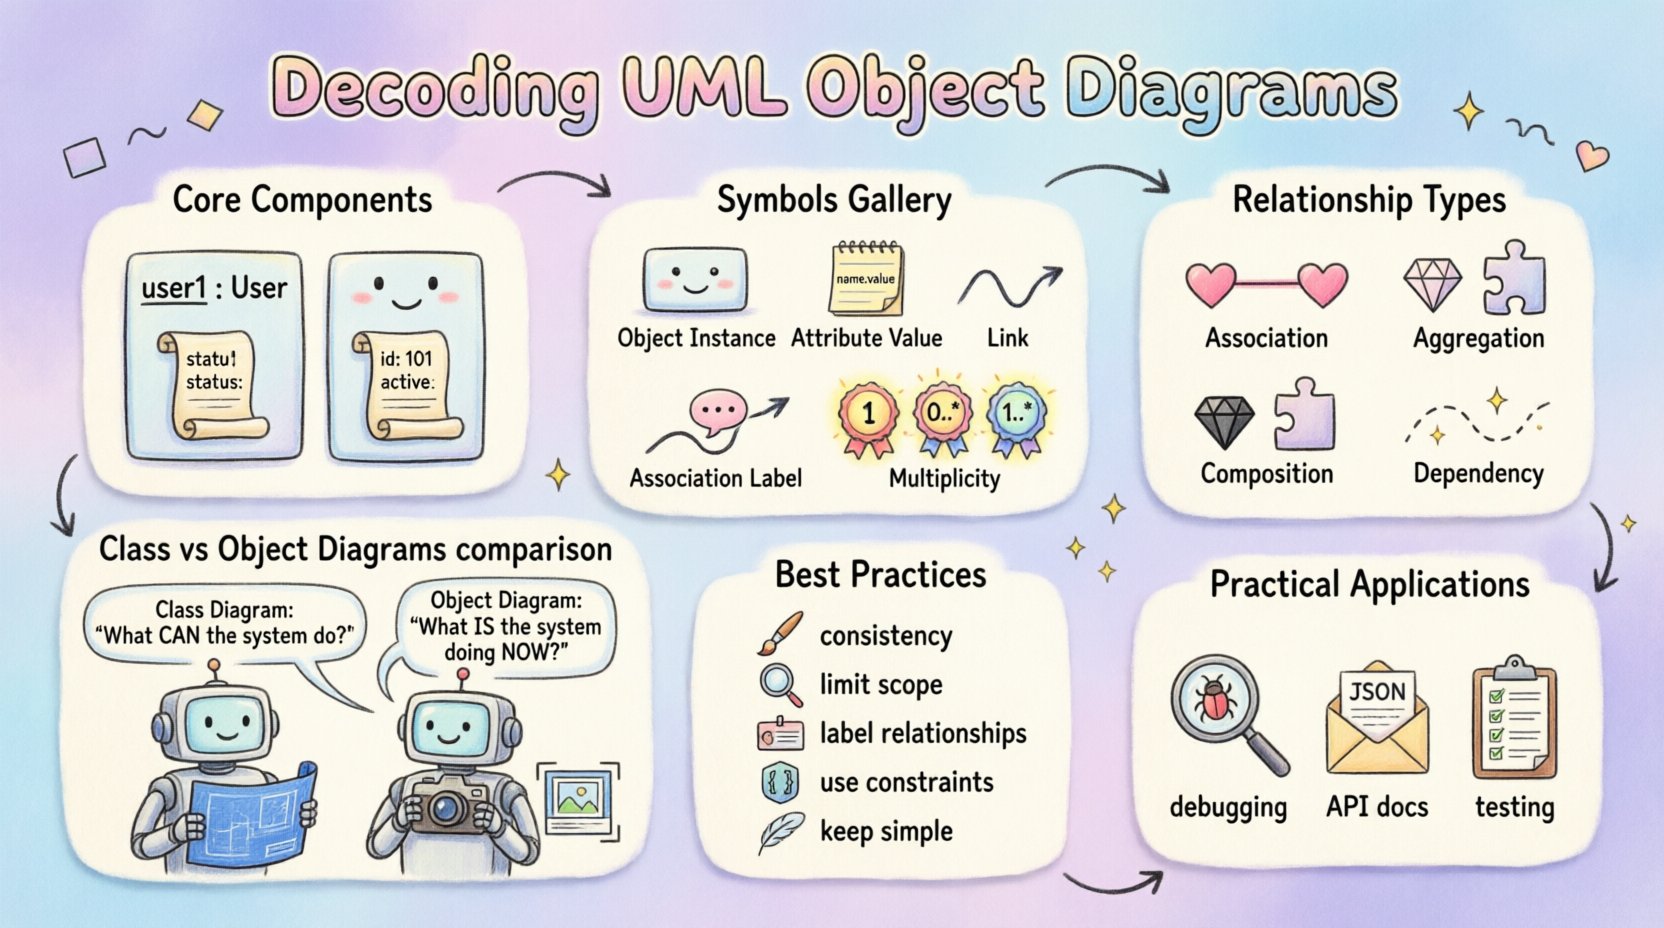
📋 Symbols and Notation Breakdown
The visual syntax of UML is consistent across diagrams, but object diagrams have specific requirements for representing state. The table below outlines the primary symbols used.
| Symbol / Element | Description | Visual Representation |
|---|---|---|
| Object Instance | Represents a specific entity in the system. | Rectangle with instance name (italic) above class name (underlined). |
| Attribute Value | Shows the current data stored in the object. | List of name : value pairs inside the rectangle. |
| Link | Connects two objects to show a relationship. | Solid line, often with an arrowhead. |
| Association Label | Describes the nature of the link between objects. | Text placed along the link line. |
| Multiplicity | Indicates how many instances participate in a relationship. | Numbers or ranges (e.g., 1, 0..*, 1..*) placed near the link ends. |
🔹 Object Rectangle Structure
The standard object rectangle is divided into sections. The top section holds the instance name in italics, followed by the class name in regular text, often underlined. The bottom section lists attribute values. For example, a user object might display user1 : User at the top, followed by id : 101 and status : active below. This format distinguishes the runtime state from the class definition.
🔹 Link and Association Notation
Links in object diagrams correspond to associations in class diagrams. A solid line connects two object rectangles. Unlike class associations, which define potential relationships, object links represent actual connections existing at a specific time. For instance, if an order object is linked to a customer object, the link signifies that this specific order was placed by this specific customer.
- Solid Lines: Used for associations.
- Arrowheads: Indicate navigation direction or role names.
- Labels: Text describing the relationship type (e.g., “places”, “owns”).
- Role Names: Specific names for the ends of an association (e.g., “buyer”, “seller”).
🔗 Understanding Relationships and Links
The strength and nature of the connection between objects are defined by the type of relationship depicted. These relationships determine how objects interact and manage dependencies.
1️⃣ Association
An association represents a structural link between objects. It is the most common relationship type. In an object diagram, this is shown as a solid line. If the relationship is bidirectional, no arrow is used. If it is unidirectional, an arrow points to the target object.
2️⃣ Aggregation
Aggregation implies a “whole-part” relationship where the parts can exist independently of the whole. Visually, this is often denoted by a hollow diamond at the “whole” end of the line. In an object diagram, this means the instance on the diamond side contains a reference to the other instance, but destroying the whole does not destroy the part.
3️⃣ Composition
Composition is a stronger form of aggregation where the parts cannot exist without the whole. This is represented by a filled diamond at the “whole” end. If the composite object is destroyed, the contained objects cease to exist as well. This notation is crucial for defining lifecycle dependencies.
4️⃣ Dependency
Dependency indicates that a change in one object may affect another, but not necessarily a structural link. It is typically shown with a dashed line and an open arrowhead. In object diagrams, this is less common than in class diagrams but can be used to show usage scenarios.
🔢 Multiplicity and Constraints
Multiplicity defines the number of instances that can participate in a relationship. Understanding these notations is vital for data integrity checks and validation logic.
- 1: Exactly one instance must exist.
- 0..1: Zero or one instance (optional).
- 1..*: One or more instances (mandatory).
- 0..*: Zero or more instances (optional).
- n: A specific number of instances.
When adding multiplicity to an object diagram, place the notation at the end of the link line near the object it describes. For example, if a Car object is composed of Wheel objects, the link might show 1 on the Car end and 4 on the Wheel end.
📝 Constraint Notation
Constraints limit the valid states or values for an object. They are often enclosed in curly braces {}. For example, a constraint might read {age >= 18} on a link connecting a Driver object to a Car object. This indicates that the specific instance must adhere to this rule.
📊 Comparing Class Diagrams vs. Object Diagrams
It is common to confuse these two diagram types. While they share syntax, their purpose and content differ significantly.
| Feature | Class Diagram | Object Diagram |
|---|---|---|
| Focus | Structure and Types | Instances and State |
| Time Context | Timeless (Blueprint) | Snapshot (Specific Moment) |
| Names | Class Names (Uppercase) | Instance Names (Lowercase + Class) |
| Attributes | Data Types | Actual Values |
| Usage | Design Phase | Testing / Runtime Verification |
Class diagrams answer “What can the system do?” while object diagrams answer “What is the system doing right now?”. This distinction is critical when documenting system behavior for debugging or testing purposes.
⚙️ Lifecycle and State Representation
Object diagrams can also hint at the lifecycle state of an instance. While state machines are separate diagrams, object diagrams capture the result of state transitions.
- Active Instances: Objects that are currently running or processing.
- Inactive Instances: Objects that exist but are not currently active.
- Transient Data: Attributes that hold temporary values during a transaction.
By documenting these states, teams can trace issues back to specific data configurations. For example, if a payment fails, an object diagram of that moment can show the status of the Payment object and its linked Order object.
🛠️ Best Practices for Design
To ensure object diagrams remain useful and readable, adhere to these design principles.
- Maintain Consistency: Use the same naming conventions across all diagrams.
- Limit Scope: Do not include every object in a system. Focus on the specific scenario being modeled.
- Label Relationships: Always label links to clarify the nature of the connection.
- Use Constraints: Add constraints to validate data rules visually.
- Keep it Simple: Avoid cluttering the diagram with too many attributes. Show only relevant values.
- Update Regularly: Ensure diagrams reflect the current system state if used for documentation.
⚠️ Common Pitfalls to Avoid
Even experienced modelers make mistakes when creating object diagrams. Recognizing these errors early saves time during development.
🔴 Overloading the Diagram
Trying to show the entire system state in one diagram creates a tangled mess. Break complex systems into smaller, focused diagrams. Each diagram should tell a specific story about a subset of the system.
🔴 Inconsistent Notation
Mixing class and object notation confuses readers. Ensure instance names are italicized and class names are underlined. Do not use class names without the instance prefix.
🔴 Ignoring Multiplicity
Failing to label multiplicities leaves the relationship open to interpretation. Always specify the minimum and maximum number of instances allowed.
🔴 Missing Values
An object diagram without attribute values is just a class diagram in disguise. Ensure that attribute values are populated to reflect the actual state.
📈 Practical Applications
Why invest time in creating these diagrams? They serve specific roles in the development lifecycle.
- Database Schema Validation: Compare object instances against database records to ensure data consistency.
- Debugging: Visualize the state of objects when a bug occurs.
- API Documentation: Show the structure of JSON responses or payloads.
- Training: Help new developers understand how objects interact in real scenarios.
- Testing: Define expected states for unit and integration tests.
🧠 Deep Dive: Complex Relationships
Sometimes relationships are not simple one-to-one links. They can be many-to-many or involve ternary relationships.
- Many-to-Many: A Student object can be linked to multiple Course objects, and vice versa. This is shown by 0..* on both ends of the link.
- Ternary Associations: Three objects linked together (e.g., Doctor, Patient, Appointment). This is rare in object diagrams but possible to show specific interactions.
- Navigability: Indicate which objects can “navigate” to others. Use arrowheads to show directionality.
📝 Conclusion
Object diagrams are a powerful tool for visualizing the concrete reality of a software system. By mastering the symbols and notation outlined in this guide, you can create clear, actionable documentation. Remember that the goal is clarity, not complexity. Use these diagrams to bridge the gap between abstract design and runtime execution.
Focus on the snapshot nature of the diagram. Ensure that every symbol serves a purpose. Validate your notation against the UML standard to maintain interoperability. With practice, these diagrams become an essential part of your technical communication toolkit.
Whether you are validating data models, debugging complex interactions, or documenting system states, object diagrams provide the necessary precision. Apply these principles consistently to enhance the quality of your system design and documentation.