


In the complex architecture of modern software systems, visualizing static structure is often just the beginning. While class diagrams define the blueprint of a system, UML object diagrams capture the actual state of that system at a specific moment in time. For full-stack teams, understanding the distinction and the application of object diagrams is critical for maintaining data integrity, debugging runtime issues, and aligning frontend and backend expectations.
These diagrams provide a snapshot of instances, their attributes, and the links connecting them. Unlike class diagrams, which represent types, object diagrams represent values. This distinction is vital when mapping the behavior of client-side applications to server-side logic. By mastering this visual language, teams can reduce ambiguity and ensure that the data flowing through the stack remains consistent.
📊 Understanding the Core Difference: Class vs. Object
Before constructing an object diagram, one must distinguish it clearly from its cousin, the class diagram. Both are part of the Unified Modeling Language (UML) and serve structural purposes, yet their utility differs significantly in a development lifecycle.
- Class Diagrams define the potential. They show the structure of the system, including classes, interfaces, attributes, and operations. They are static and do not change unless the codebase is refactored.
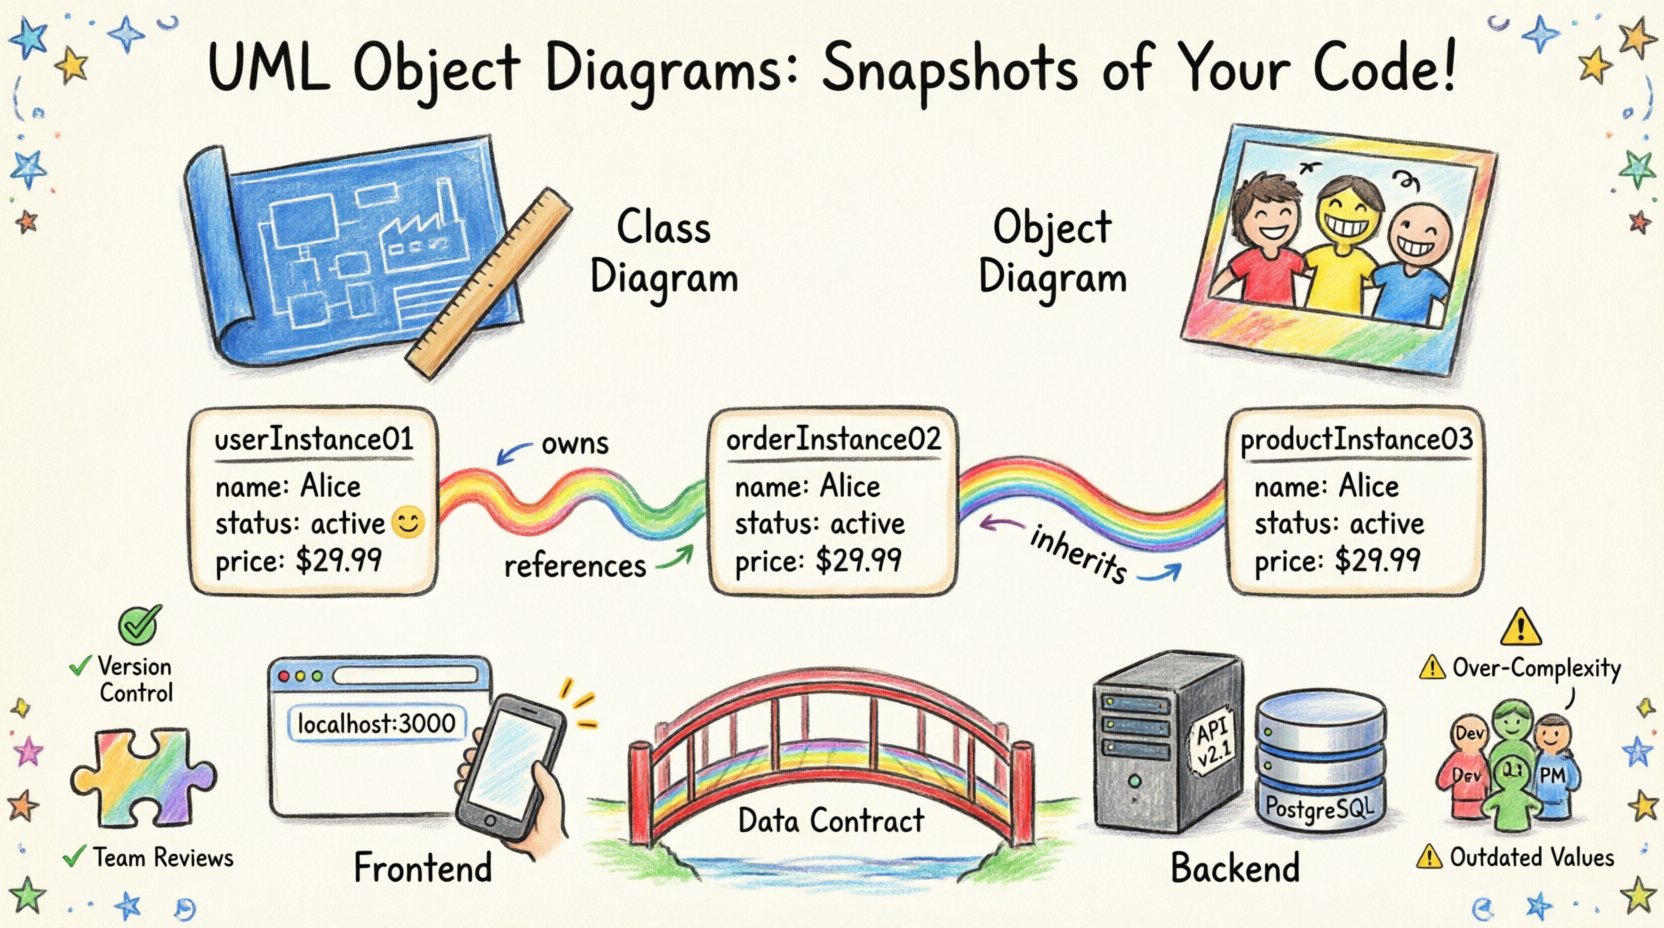
- Object Diagrams define the reality. They show instances of classes (objects) and their specific attribute values at a given time. They represent a snapshot of the system in operation.
Think of a class diagram as a factory blueprint and an object diagram as a photo of the products on the assembly line. In a full-stack environment, the frontend interacts with objects, while the backend manages the classes that generate them. Confusing the two can lead to implementation errors where the expected data shape does not match the actual runtime state.
🧩 Anatomy of an Object Diagram
Constructing a valid object diagram requires adherence to specific modeling rules. Each element must be accurately represented to ensure the diagram conveys meaningful information about the system’s state.
1. Instances and Object Names
Every object in the diagram must have a unique name. The convention typically involves underlining the object name. For example, userInstance01 represents a specific user record. This uniqueness is essential when tracing data flow through the application.
2. Attributes and Values
Unlike class diagrams, which list attribute names and types, object diagrams display the actual values held by the instances. If a Client class has a property name, an object diagram might show name: "Alice". This level of detail helps developers understand the current state of data without running the application.
3. Links and Associations
Links represent relationships between instances. These are the connections that data travels along. A link might connect a ShoppingCart object to a Product object. The direction of the link and its multiplicity (e.g., one-to-many) define the constraints of the relationship at runtime.
🔗 Why Full-Stack Teams Need Object Diagrams
In a monolithic architecture, the boundary between layers is often blurred. In a distributed full-stack environment, the separation is distinct. Object diagrams bridge this gap by visualizing the data contract between the client and the server.
- Frontend State Management: Modern clients rely heavily on state. Object diagrams can model the state of the application as it appears to the user, helping UI/UX designers and frontend developers align on data availability.
- Backend Persistence: When mapping objects to database records, object diagrams clarify which instances are transient and which are persistent. This distinction is crucial for managing sessions and caching strategies.
- API Documentation: While OpenAPI and Swagger define endpoints, object diagrams define the payload structure. They offer a visual alternative to verbose JSON schemas.
- Debugging Complex Flows: When an error occurs, a static log is insufficient. An object diagram can reconstruct the state of the system at the time of failure, showing exactly which objects were linked and what values they held.
📋 Comparison: Class Diagram vs. Object Diagram
The following table highlights the key distinctions to ensure the correct model is used for the specific task at hand.
| Feature | Class Diagram | Object Diagram |
|---|---|---|
| Representation | Blueprint / Type | Instance / Snapshot |
| Focus | Structure and Behavior | State and Relationships |
| Attribute Display | Names and Types | Names and Actual Values |
| Change Frequency | Static (Rare) | Dynamic (Frequent) |
| Primary Use Case | Database Schema Design | Runtime State Analysis |
💻 Building the Diagram: A Step-by-Step Process
Creating an effective diagram requires a disciplined approach. It is not enough to simply draw boxes; the model must reflect the logic of the application. Follow this structured process to build diagrams that add value to the team.
Step 1: Identify the Scope
Do not attempt to model the entire system at once. Select a specific scenario or use case. For example, model the state of a user during the checkout process. This keeps the diagram focused and readable.
Step 2: Define the Instances
List the objects involved in the scenario. Consider the frontend session object, the backend request object, and the database record object. Ensure each has a unique identifier.
Step 3: Assign Attribute Values
Fill in the data values. If modeling a login flow, specify the status as "Authenticated" or "Failed". This adds context to the diagram that a class diagram cannot provide.
Step 4: Draw the Links
Connect the objects according to the business logic. Ensure that the multiplicity constraints are respected. For instance, a single user session cannot belong to two different users simultaneously.
Step 5: Review and Validate
Verify the diagram against the codebase. Does the object structure match the actual implementation? If the diagram is outdated, it becomes noise rather than a tool. Regularly update the diagrams to reflect code changes.
📱 Contextualizing for Frontend and Backend
Full-stack development involves two distinct worlds: the browser and the server. Object diagrams help synchronize these worlds by visualizing the data transformation.
The Frontend Perspective
On the client side, objects are often lightweight and transient. They may be cached in memory or local storage. An object diagram here helps visualize the component tree and the data bound to it. This is particularly useful for debugging race conditions where state updates occur out of order.
The Backend Perspective
On the server side, objects are often heavier and persistent. They interact with databases and external services. The diagram should reflect the lifecycle of these objects. For example, an object might transition from "Created" to "Processing" to "Completed". Showing these states helps backend engineers understand the flow of work items.
⚠️ Common Pitfalls to Avoid
Even experienced architects make mistakes when modeling instances. Being aware of common errors can save significant time during the review process.
- Over-Complexity: Including every possible object in a single diagram makes it unreadable. Stick to the specific scenario you are modeling.
- Mixing Types and Instances: Do not mix class definitions with object instances in the same diagram. Keep them separate to maintain clarity.
- Outdated Values: If the attribute values are generic placeholders, the diagram loses its purpose. Use realistic data that reflects actual production scenarios.
- Ignoring Multiplicity: Failing to indicate the number of links (e.g., one-to-many) can lead to confusion about data ownership and relationships.
- Lack of Context: A diagram without a title or scenario description is ambiguous. Always label the diagram with the specific use case it represents.
✅ Best Practices for Maintenance
Once a diagram is created, it requires maintenance to remain useful. Treat documentation as code; it must evolve with the system.
- Version Control: Store diagram files alongside the source code. This ensures that changes to the model are tracked and reviewed.
- Automated Checks: Where possible, generate diagrams from the codebase. This ensures that the visual model always matches the actual implementation.
- Team Reviews: Include diagrams in pull request reviews. This ensures that new features do not break existing data relationships.
- Standardize Notation: Ensure all team members follow the same naming conventions and notation rules. Consistency reduces the learning curve for new team members.
🤝 Collaboration Across Disciplines
Object diagrams are a universal language that facilitates communication between different roles within a development team.
- For Developers: They serve as a reference for data structures and relationships during implementation.
- For QA Engineers: They provide a baseline for creating test cases based on specific object states.
- For Product Managers: They offer a high-level view of how data flows through the system without getting bogged down in technical details.
- For DevOps: They help understand the dependencies between services and the state required for deployment.
By aligning these groups on a shared visual model, teams can reduce misunderstandings and accelerate the delivery of high-quality software. The diagram becomes a source of truth that everyone can reference.
🔄 Handling Dynamic Changes
Software systems are rarely static. Features are added, and data models change. Object diagrams must adapt to these changes.
- Refactoring: When code is refactored, update the corresponding diagrams to reflect the new structure.
- Versioning: If the system supports multiple versions, maintain separate diagrams for each version to avoid confusion.
- Deprecation: Clearly mark deprecated objects or links. This prevents new development from relying on outdated structures.
📝 Summary of Key Takeaways
Building effective UML object diagrams is a discipline that requires attention to detail and a clear understanding of the system’s runtime behavior. For full-stack teams, these diagrams are not just documentation; they are tools for alignment and debugging.
- Focus on Instances: Remember that object diagrams show values, not just types.
- Keep it Scoped: Model specific scenarios rather than the entire system.
- Maintain Accuracy: Ensure the diagram reflects the current state of the codebase.
- Use for Communication: Leverage the visual nature of the diagram to bridge gaps between technical and non-technical stakeholders.
By integrating these practices into the development workflow, teams can achieve a higher level of clarity and consistency. The effort invested in creating and maintaining these diagrams pays off in reduced bugs, clearer communication, and a more robust system architecture.
🚀 Moving Forward
As systems grow in complexity, the need for precise modeling increases. Object diagrams provide the necessary granularity to manage that complexity. Start small, focus on critical paths, and gradually expand the documentation as the team matures. The goal is not perfection, but clarity. With a clear visual representation of the data state, full-stack teams can navigate the challenges of modern development with confidence.