


Creating an effective Object Diagram requires a deep understanding of instance behavior at a specific moment in time. While Class Diagrams define the blueprint of a system, Object Diagrams provide a snapshot of actual data. This guide explores advanced modeling strategies to ensure accuracy, clarity, and maintainability. We will examine how to represent complex relationships, handle constraints, and maintain consistency across large-scale architectures. 📊
Understanding the Core Purpose 🎯
An Object Diagram is a static structure diagram. It shows instances of classes, their relationships, and the values of their attributes at a specific point in time. Unlike Class Diagrams which show general types, Object Diagrams show concrete examples. This distinction is critical for debugging, validation, and documentation.
- Instances: Specific objects created from classes.
- Links: Connections between objects representing associations.
- Attribute Values: Concrete data stored within the objects.
When constructing these diagrams, the goal is to reflect the runtime state accurately. This helps stakeholders visualize how data flows through the system. It also serves as a verification step for the Class Diagram structure.
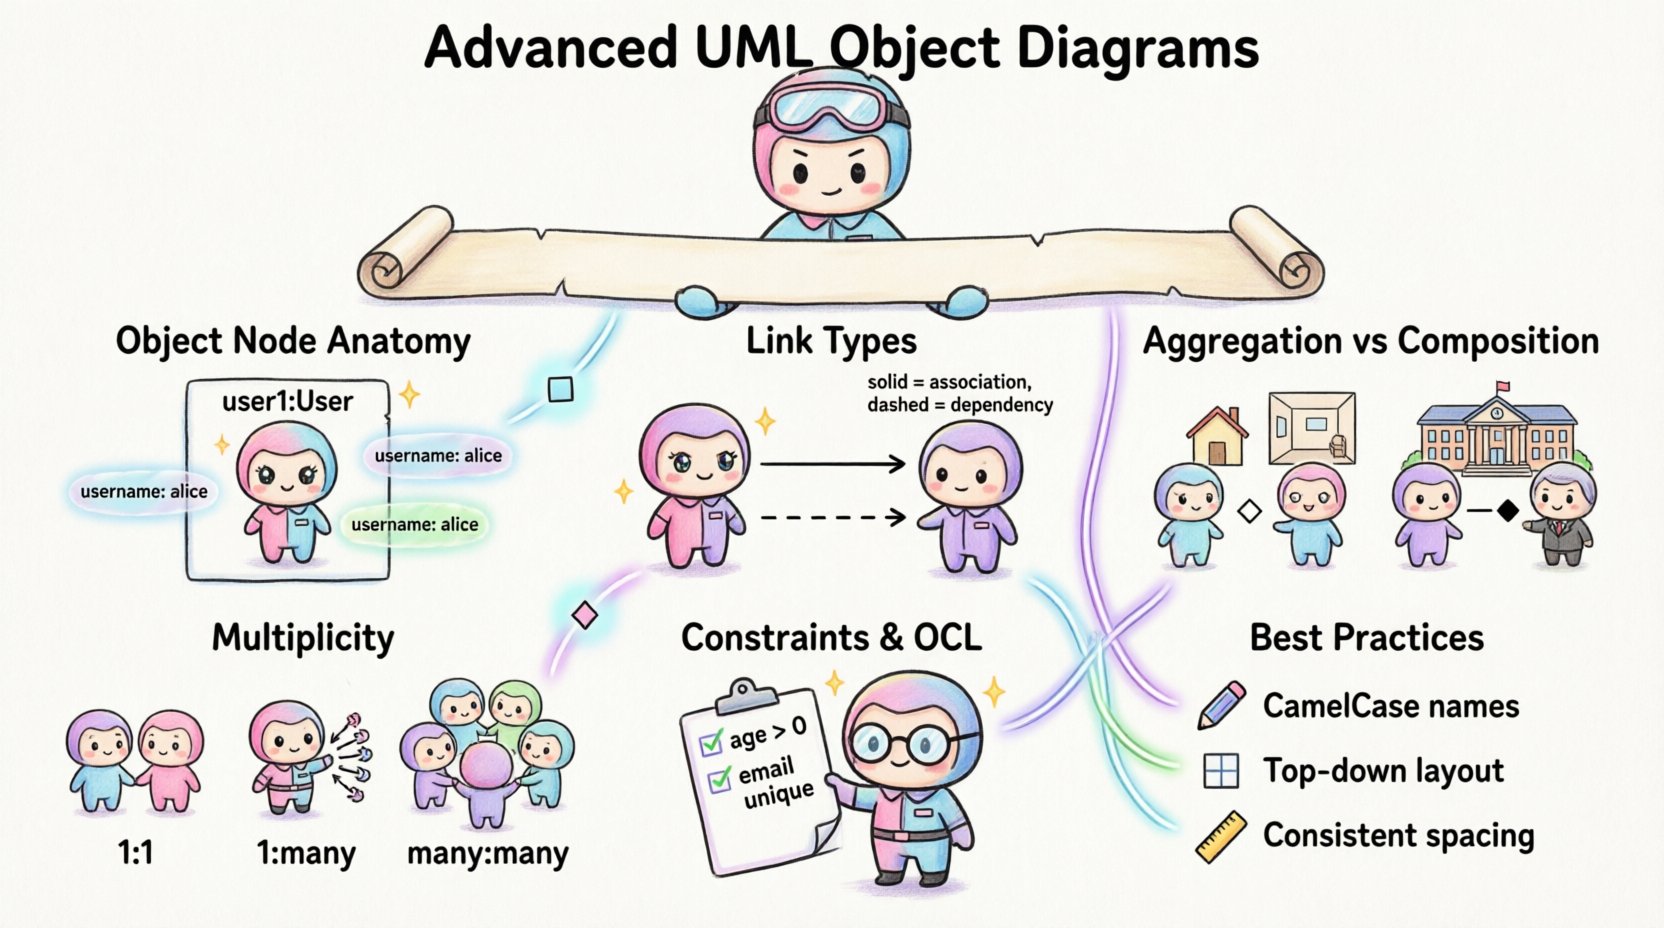
Anatomy of an Object Node 🧩
Each object node in a diagram consists of a specific set of components. Understanding these components allows for precise modeling.
- Object Name: Usually formatted as instanceName:ClassName.
- Separator: A colon separates the name from the class type.
- Attributes: Listed below the name with their current values.
- Operations: Often omitted in Object Diagrams unless showing state transitions.
For example, a user object might look like user1:User. The attributes section would display specific values, such as username: "alice". This level of detail distinguishes the diagram from a generic class definition.
Linking Objects: Associations and Dependencies 🔗
Links represent relationships between specific instances. They mirror the associations defined in the Class Diagram but apply to concrete data.
Association Links
Association links connect two object nodes. They indicate that one object interacts with or holds a reference to another. In advanced construction, consider the following:
- Role Names: Label the ends of the link to indicate the role played by the object.
- Navigation: Indicate which direction the link is navigable using arrows.
- Multiplicity: Ensure the number of links matches the defined multiplicity rules.
Dependency Relationships
Dependencies indicate a usage relationship. If one object changes, it might impact the other. In Object Diagrams, these are often shown as dashed lines.
| Relationship Type | Symbol | Usage Context |
|---|---|---|
| Association | Solid Line | Permanent structural relationship |
| Dependency | Dashed Line | Temporary usage or service request |
| Aggregation | Hollow Diamond | Whole-Part relationship (independent life cycle) |
| Composition | Filled Diamond | Whole-Part relationship (dependent life cycle) |
Multiplicity and Cardinality in Instances 🔢
Multiplicity defines the number of instances that can be connected. In Object Diagrams, this is visualized by the actual number of links drawn.
- One-to-One: Only one link exists between the two objects.
- One-to-Many: One object connects to multiple instances of another class.
- Many-to-Many: Multiple objects on both sides are connected.
When modeling, ensure the visual representation matches the theoretical constraints. If a Class Diagram specifies a multiplicity of 0..1, the Object Diagram should not show two links from the same source to the same target unless it represents a different instance.
Aggregation and Composition Nuances 💎
Distinguishing between Aggregation and Composition is vital for understanding object lifecycles. This distinction affects how the system behaves when the parent object is destroyed.
Aggregation
Aggregation implies a weak relationship. The child objects can exist independently of the parent. In a diagram, this is shown with a hollow diamond.
- Example: A Department object aggregates Professor objects. If the Department is dissolved, the Professors still exist.
- Visual:
Department—(◇)—Professor
Composition
Composition implies a strong relationship. The child objects depend on the parent for their existence. If the parent is destroyed, the child is destroyed. In a diagram, this is shown with a filled diamond.
- Example: A House object composes Room objects. If the House is removed, the Rooms cease to exist.
- Visual:
House—(◆)—Room
Constraints and OCL Integration 📝
Constraints restrict the state of objects. While often defined in Class Diagrams, Object Diagrams can show specific constraint instances.
- Invariant Constraints: Conditions that must always be true for an object.
- Preconditions: Requirements that must be met before an operation executes.
- Postconditions: Results that must be true after an operation.
When using Object Constraint Language (OCL), embed the logic as text notes or comments within the diagram. This adds precision without cluttering the visual structure.
| Constraint Type | Example Logic | Diagram Representation |
|---|---|---|
| Range Constraint | age > 0 | Text note attached to attribute |
| Uniqueness Constraint | email is unique | UML constraint box |
| State Constraint | status = “active” | Label on object node |
Best Practices for Naming and Layout 📐
Consistency is key for maintaining large diagrams. Follow established naming conventions to ensure readability.
Naming Conventions
- Prefixes: Use prefixes to distinguish object types (e.g.,
obj,inst). - CamelCase: Use camelCase for object names and PascalCase for class names.
- Uniqueness: Ensure every object name is unique within the diagram.
Layout Strategies
A cluttered diagram hinders understanding. Use layout strategies to improve clarity.
- Grouping: Cluster related objects together.
- Spacing: Maintain consistent spacing between nodes.
- Orientation: Align links horizontally or vertically to reduce crossings.
- Hierarchy: Place primary objects at the top or center.
Relationship with Class Diagrams 🔄
Object Diagrams must align with Class Diagrams. Any object instance shown must have a corresponding class definition.
- Verification: Check that all class names in the Object Diagram exist in the Class Diagram.
- Attribute Consistency: Ensure attribute types match the class definition.
- Link Consistency: Verify that link relationships match the association definitions.
This alignment ensures that the model remains coherent. Discrepancies can lead to implementation errors.
Common Errors and Validation ⚠️
Even experienced modelers make mistakes. Identifying common errors helps in validation.
- Orphaned Objects: Objects with no links that should be connected.
- Missing Values: Attributes without assigned values when required.
- Inconsistent Multiplicity: More links than allowed by the multiplicity rule.
- Loop References: Circular references that are not logically intended.
Validation involves reviewing the diagram against the rules of the Unified Modeling Language. Automated tools can assist, but manual review is essential for context.
Maintenance and Evolution 🔄
Object Diagrams are snapshots. They change as the system evolves. Maintaining them requires a strategy.
- Versioning: Keep historical versions of diagrams for reference.
- Documentation: Update the diagram when significant data changes occur.
- Automation: Use scripts to generate diagrams from actual data instances.
This approach ensures the documentation remains relevant. It reduces the gap between the design and the implementation.
Integration with Other Diagrams 🧩
Object Diagrams do not exist in isolation. They interact with other UML diagram types.
Sequence Diagrams
Sequence Diagrams show interactions over time. Object Diagrams show the static structure at a point in time. Use Object Diagrams to define the initial state for a Sequence Diagram.
State Diagrams
State Diagrams show behavior changes. Object Diagrams show the data associated with those states. Ensure the object attributes reflect the current state of the system.
Component Diagrams
Component Diagrams show physical modules. Object Diagrams show logical instances. Map instances to components to understand deployment.
Conclusion on Modeling Standards ✅
Advanced Object Diagram construction requires attention to detail. By focusing on instances, links, and constraints, you create a robust model. This model supports better communication and reduces ambiguity. Consistency and validation are the pillars of success. Follow the standards, and the diagrams will serve their purpose effectively.
Remember, the diagram is a tool for understanding. It should clarify the system, not complicate it. Use these techniques to build models that stand the test of time and change.