When software systems grow in complexity, understanding the static structure of data at a specific moment becomes critical. While Class Diagrams define the blueprint of a system, Object Diagrams provide the actual snapshot of that blueprint in action. This distinction is vital for system architects, developers, and analysts who need to validate data integrity, trace relationships, and verify state consistency before deployment. This guide explores how to leverage UML Object Diagrams for deep system state analysis.
🔍 Defining the Object Diagram
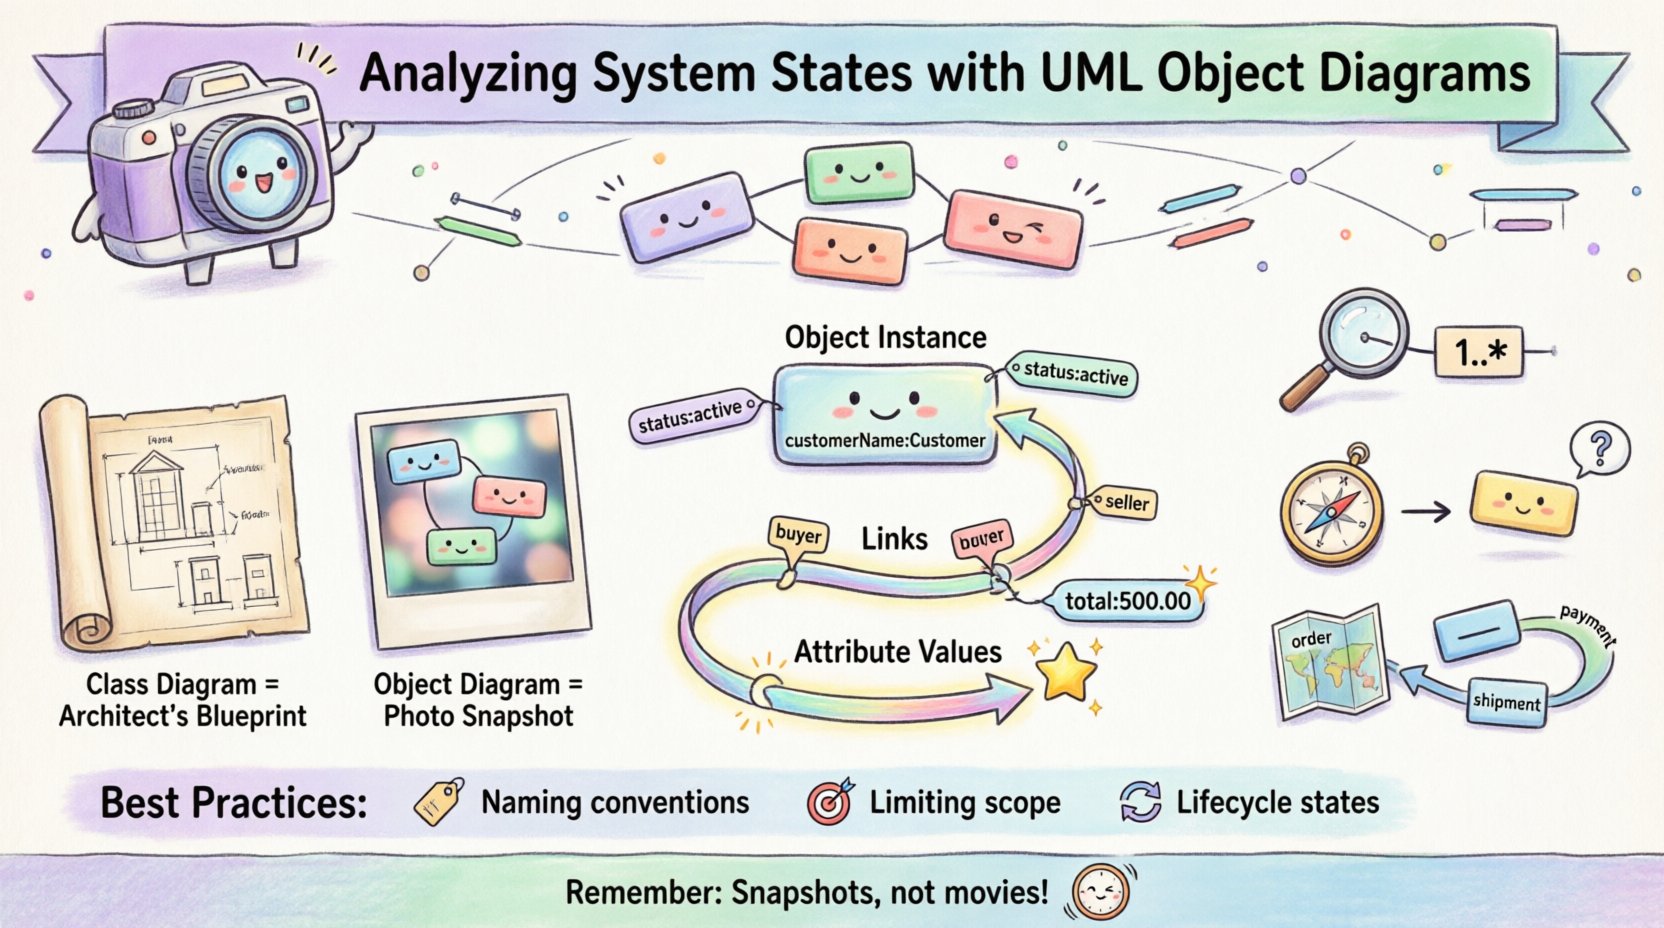
An Object Diagram is a static snapshot of a system at a specific point in time. It represents instances of classes, known as objects, and the links connecting them. Unlike Class Diagrams that show potential structures, Object Diagrams show concrete values and real-time associations. Think of a Class Diagram as a blueprint for a house, and an Object Diagram as a photo of the house during construction.
- Focus: Concrete instances rather than abstract definitions.
- Timeframe: A specific moment or state within the system lifecycle.
- Utility: Debugging, documentation, and validation of data models.
In the context of system analysis, these diagrams allow stakeholders to see exactly how data flows through the architecture. They reveal orphaned objects, broken links, and state inconsistencies that are often invisible in high-level design documents.
🏗️ Core Components of Object Diagrams
To analyze system states effectively, one must understand the syntax and semantics of the diagram elements. Each component serves a specific purpose in representing the runtime environment.
1. Object Instances
Objects are represented by rectangles containing the object name and the class name. The standard notation places the object name in bold, followed by a colon, and then the class name.
- Notation: customerName: Customer
- Attributes: Specific values for attributes are often displayed within the object box to illustrate state.
- Visibility: Standard visibility modifiers (+, -, #) apply to attributes if detailed enough.
2. Links
Links represent the connections between objects. They correspond to associations defined in Class Diagrams but exist between instances.
- Direction: Links can be bidirectional or unidirectional.
- Role Names: Links often carry role names at each end to clarify the relationship from the perspective of the connected objects.
- Multiplicity: The number of objects connected at each end must adhere to the constraints defined in the class model.
3. Attribute Values
One of the most powerful features of Object Diagrams is the ability to show specific attribute values. This transforms the diagram from a structural map into a state validator.
- Example: An object named order1 might show status: pending or total: 500.00.
- Benefit: This allows analysts to verify if an object is in a valid state according to business rules.
⚖️ Object Diagrams vs. Class Diagrams
Understanding the differences between these two modeling techniques is essential for selecting the right tool for the job. Confusing them can lead to design errors or miscommunication during system reviews.
| Feature | Class Diagram | Object Diagram |
|---|---|---|
| Representation | Abstract classes and interfaces | Concrete instances (objects) |
| Time Context | Static, timeless structure | Snapshot at a specific moment |
| Usage | Design phase, blueprint creation | Validation, testing, debugging |
| Complexity | High-level relationships | Detailed instance data |
| Change Frequency | Changes infrequently | Changes with every state transition |
📊 Analyzing System States
The primary value of an Object Diagram lies in its ability to analyze state. By visualizing the system at a specific point, analysts can identify issues that might cause runtime failures or logic errors.
1. Validating Data Integrity
When reviewing an Object Diagram, check for violations of multiplicity constraints. If a Class Diagram specifies that a Customer can have zero or one Invoice, but the Object Diagram shows three invoices linked to a single customer instance, there is a data integrity issue.
- Check Multiplicity: Ensure link counts match cardinality rules.
- Check Referential Integrity: Ensure foreign keys (links) point to valid existing objects.
- Check Nulls: Identify objects that are required but missing connections.
2. Identifying Orphaned Objects
Orphaned objects are instances that exist in memory or storage but have no links to other objects in the graph. While sometimes valid (e.g., a draft item), they often represent memory leaks or incomplete transactions.
- Signs: An object with no incoming or outgoing links.
- Risk: These objects consume resources without contributing to system functionality.
- Resolution: Implement cleanup routines or ensure proper lifecycle management.
3. Tracing Data Flow Paths
Object Diagrams help visualize how data moves through the system at a high level. By following links, you can trace the path from a user input object to the final storage object.
- Path Analysis: Count the number of hops between start and end objects.
- Performance: Deep link chains may indicate performance bottlenecks.
- Security: Ensure sensitive data objects are only linked to authorized access objects.
🛠️ Best Practices for State Modeling
To maximize the utility of Object Diagrams during analysis, adhere to consistent modeling standards. Inconsistency leads to confusion and reduces the diagram’s value as a communication tool.
1. Naming Conventions
Clear naming is non-negotiable. Use descriptive names that reflect the object’s role in the current state.
- Prefixing: Use prefixes like cust_ or inv_ to indicate the class type quickly.
- Context: Name objects based on their context, e.g., activeOrder rather than just order1.
- Consistency: Maintain uniformity across all diagrams in the project.
2. Limiting Scope
Object Diagrams can become cluttered very quickly. A single diagram should focus on a specific scenario or subsystem.
- Modularity: Create separate diagrams for different modules (e.g., Billing vs. Shipping).
- Relevance: Only include objects relevant to the current analysis state.
- Readability: If a diagram exceeds one screen, it is likely too complex.
3. Representing Lifecycle States
Many objects exist in different lifecycle stages (e.g., Active, Archived, Deleted). Represent these states clearly using attribute values.
- State Attributes: Use a status attribute to denote the lifecycle phase.
- Visual Cues: Consider using different colors or shapes if supported by the modeling tool.
- Validation: Ensure state transitions follow defined business logic.
🔎 Practical Analysis Scenarios
The following scenarios illustrate how Object Diagrams are used in real-world technical analysis.
Scenario 1: Transaction Verification
During a financial transaction review, an analyst needs to ensure that money was debited and credited correctly. An Object Diagram can show the SourceAccount, DestinationAccount, and TransactionRecord objects.
- Check: Do the amounts match?
- Check: Is the transaction marked as completed?
- Check: Are both accounts linked to the same BankSystem instance?
Scenario 2: Database Migration Validation
When migrating data to a new schema, Object Diagrams help verify that the new structure supports the existing data.
- Check: Do old objects map to new classes?
- Check: Are any required links missing in the new schema?
- Check: Are attribute values preserved correctly?
Scenario 3: Security Audit
An auditor may use an Object Diagram to see which users have access to specific sensitive resources.
- Check: Are unauthorized users linked to protected objects?
- Check: Is the Role attribute correctly assigned?
- Check: Are there any direct links bypassing the Authentication layer?
⚠️ Common Pitfalls and Limitations
While powerful, Object Diagrams have inherent limitations. Understanding these prevents over-reliance on a single modeling technique.
- Static Nature: They do not show behavior or state transitions over time. They are snapshots, not movies.
- Scalability: Large systems with thousands of instances cannot be effectively represented in a single diagram.
- Maintenance: Keeping diagrams up-to-date with code changes is labor-intensive.
- Dynamic Behavior: Complex logic involving loops or conditional branching is hard to capture statically.
To mitigate these issues, combine Object Diagrams with Sequence Diagrams for behavior and Class Diagrams for structure. Use them specifically when the state of data is the primary concern.
📝 Documentation and Communication
Beyond technical analysis, Object Diagrams serve as excellent documentation assets. They bridge the gap between technical teams and business stakeholders.
1. Onboarding New Developers
When a new developer joins a project, they need to understand the data model. Object Diagrams provide a concrete example of how data looks in practice, which is often easier to grasp than abstract class definitions.
- Example Data: Show a fully populated instance.
- Relationships: Visualize how entities connect.
- Context: Explain the business meaning of the attributes.
2. Defining Acceptance Criteria
QA teams can use Object Diagrams to define acceptance criteria for testing. They can specify exactly what the object graph should look like after a specific test case runs.
- Expected State: Define the target object configuration.
- Validation Points: Highlight critical attributes to check.
- Failure Modes: Show what the diagram looks like when an error occurs.
🚀 Integration with Development Workflows
Integrating Object Diagrams into the software development lifecycle ensures that state analysis is not an afterthought but a continuous practice.
1. Design Phase
During design, create Object Diagrams for critical use cases. This forces the team to think about actual data values, not just types.
2. Code Review
During code reviews, compare the actual code objects against the design Object Diagrams. Look for discrepancies in attribute names or link structures.
3. Testing Phase
Use Object Diagrams to generate test data. If the diagram shows a Customer with status: VIP, the test suite should include scenarios for VIP privileges.
🧩 Advanced State Representation
For complex systems, standard Object Diagrams may need extension to represent dynamic states effectively.
1. Aggregations and Compositions
When analyzing strong ownership relationships, distinguish between Aggregation (weak) and Composition (strong). In an Object Diagram, this is often shown by the fill of the diamond shape on the link.
- Composition: If the parent object dies, the child object dies.
- Aggregation: The child can exist independently.
2. Value Objects
Value objects (like Money or Date) do not have identity. In Object Diagrams, they are often represented inline or with specific notation to indicate they are not independent instances.
3. Interfaces and Realizations
While less common in Object Diagrams, it is possible to show which objects realize specific interfaces. This is useful for verifying dependency injection or plugin architectures.
- Check: Does the object implement all required methods?
- Check: Are the method signatures compatible?
🔧 Tools and Automation
Manual drawing of Object Diagrams is time-consuming. Modern modeling tools offer features to automate parts of this process.
- Code Generation: Generate diagrams from existing codebases to verify alignment.
- Round-Trip Engineering: Update diagrams when code changes.
- Export Options: Export to PDF or image for documentation.
However, automation should not replace analysis. Automated tools often miss the context required to determine if a state is valid or invalid. Human judgment remains essential.
📈 Measuring Effectiveness
How do you know if using Object Diagrams is improving your system analysis? Look for these metrics.
- Defect Detection Rate: Are you finding data integrity issues earlier in the lifecycle?
- Communication Speed: Are stakeholders understanding the data model faster?
- Documentation Accuracy: Is the documentation synchronized with the code?
🌐 Future Considerations
As systems evolve towards microservices and cloud-native architectures, the role of Object Diagrams shifts. Distributed systems require diagrams that span multiple services.
- Service Boundaries: Clearly mark which objects belong to which service.
- Network Links: Represent remote calls as links between service instances.
- Data Consistency: Use diagrams to analyze eventual consistency models.
While the techniques remain the same, the scope expands. Architects must consider how state propagates across network boundaries.
🏁 Final Considerations
UML Object Diagrams are a specialized but powerful tool for system architects and developers. They provide a concrete view of abstract designs, allowing for rigorous analysis of system states. By focusing on instances, links, and attribute values, teams can identify structural issues before they become runtime failures.
Remember that these diagrams are snapshots. They complement dynamic models like Sequence and State diagrams but do not replace them. Use them where data integrity and structure validation are paramount. Maintain them rigorously, keep them simple, and ensure they reflect the current reality of your system. When used correctly, they become an indispensable part of the engineering toolkit, bridging the gap between theory and practice.