Understanding the architecture of your software requires more than just writing code. It demands visualization. While class diagrams show the blueprint of your system, UML object diagrams capture the specific state of that system at a particular moment. For developers stepping into complex software design, grasping how instances interact is crucial for debugging, documentation, and communication.
This guide provides a deep dive into object diagrams. We will explore their structure, syntax, and practical application without relying on specific tools or marketing hype. By the end of this read, you will understand how to construct these diagrams to clarify runtime behavior.
🧩 What Is an UML Object Diagram?
An UML object diagram is a static structural diagram. It represents a snapshot of the system at a specific point in time. Unlike a class diagram, which defines the potential structure (types, attributes, operations), an object diagram shows actual data populated within those structures.
Think of a class diagram as a recipe for a cake. It lists ingredients and steps. An object diagram is the actual cake sitting on the table. It shows the result of executing the recipe. In technical terms, it displays:
- Objects: Instances of classes.
- Links: Connections between objects.
- Attributes: Current values held by the objects.
- State: The status of the system at that moment.
These diagrams are particularly useful when you need to explain complex object interactions to stakeholders who might not understand abstract class hierarchies. They ground the conversation in concrete examples.
🔑 Key Components & Notation
Before drawing, you must understand the visual language. Object diagrams use specific notations to convey meaning efficiently. Below is a breakdown of the essential elements.
| Element | Visual Representation | Purpose |
|---|---|---|
| Object | Rectangle with bold underline | Represents a specific instance of a class. |
| Class Name | Top part of the rectangle | Identifies the type of the object. |
| Object Name | Bottom part of the rectangle (underlined) | Unique identifier for the instance. |
| Attributes | List inside the rectangle | Shows current data values. |
| Link | Line connecting objects | Represents a relationship between instances. |
| Multiplicity | Numbers near the ends of lines | Indicates how many objects can connect. |
1. Object Boxes
Each object is drawn as a rectangle. The top section contains the class name (e.g., Customer). The bottom section contains the object name, prefixed with a colon. For example, :Customer or john_doe:Customer. The object name is often underlined to distinguish it from the class name.
Inside the box, you list the attributes. In a class diagram, attributes describe types (e.g., age: int). In an object diagram, you show actual values (e.g., age: 28). This distinction is vital for understanding runtime data.
2. Links and Associations
Links represent relationships between objects. They are drawn as solid lines connecting the boxes. Unlike class associations which define potential connections, links define actual connections.
- Association Names: Labels on the line describing the relationship (e.g.,
owns,manages). - Role Names: Labels at the ends of the line indicating the perspective of the object.
🆚 Object Diagram vs. Class Diagram
Confusion often arises between these two diagram types. Both are structural, but their focus differs significantly. Understanding when to use which is a key skill for technical writers and architects.
| Feature | Class Diagram | Object Diagram |
|---|---|---|
| Focus | Types and Definitions | Instances and Data |
| Lifespan | Static (Blueprint) | Dynamic (Snapshot) |
| Attributes | Data Types | Actual Values |
| Usage | Design Phase | Debugging & Documentation |
| Complexity | Can be large & abstract | Usually smaller & concrete |
While a class diagram answers “What can the system do?”, an object diagram answers “What is the system doing right now?”. Using both together provides a complete picture of your software’s design and behavior.
🛠️ How to Create an Object Diagram
Creating these diagrams requires a logical flow. You cannot simply draw boxes randomly; they must reflect valid relationships defined in your class structure. Follow this process to ensure accuracy.
Step 1: Define the Scope
Start by identifying the specific scenario you are modeling. Are you documenting a login sequence? Showing a database transaction? Or illustrating a specific error state? Narrowing the scope prevents the diagram from becoming cluttered.
Step 2: Identify the Objects
Look at your class diagram and select the classes relevant to your scenario. Create instances for each. Ensure you name them clearly. Avoid generic names like obj1 unless it is a temporary variable. Use descriptive names like user_session_01.
Step 3: Assign Attribute Values
Populate the attribute sections with realistic data. If you are modeling a shopping cart, the price attribute should be a number, not a string like “price”. Consistency in data types helps maintain the integrity of the model.
Step 4: Establish Links
Connect the objects using lines that mirror the associations in your class diagram. Ensure the directionality matches. If the class diagram shows a one-to-many relationship, ensure the object diagram reflects the actual count of links present in this snapshot.
Step 5: Add Multiplicity Constraints
Include multiplicity indicators at the ends of the links. This clarifies the cardinality of the relationship. Common notations include:
- 1: Exactly one.
- 0..1: Zero or one.
- 1..*: One or more.
- 0..*: Zero or more.
These numbers help readers understand the constraints without reading the code.
📝 Syntax Rules and Conventions
To maintain professional standards, adhere to established conventions. Deviating from these can cause confusion among team members who are familiar with the standard.
- Underlining: Always underline the object name. This is the primary visual cue distinguishing an instance from a class.
- Visibility: You can include visibility symbols (+, -, #, ~) before attribute names, but it is often omitted in object diagrams to save space unless the value itself is sensitive.
- Formatting: Keep the text within boxes legible. Do not let text overflow the boundaries without wrapping cleanly.
- Colors: While black and white is standard, using color to group related objects can improve readability. However, ensure the diagram remains readable when printed in grayscale.
- Link Labels: Place association names near the middle of the line. Place role names near the object box.
🚫 Common Mistakes to Avoid
Even experienced developers make errors when modeling. Being aware of these pitfalls helps you produce cleaner, more accurate diagrams.
- Mixing Class and Object Notation: Do not mix class names and object names in the same box. Keep the hierarchy clear.
- Ignoring Multiplicity: Drawing a link without specifying multiplicity leaves ambiguity about how many objects are involved.
- Overloading: Trying to show every single object in a system. Object diagrams are snapshots. Showing too much data creates noise.
- Incorrect Attribute Types: Writing “status: active” when the type is an integer code. Stick to the data types defined in your schema.
- Disconnected Objects: Leaving objects floating without links unless they are standalone entities. Isolated objects often indicate a missing relationship.
🔍 Best Practices for Readability
A diagram is a communication tool. If no one can read it, it fails its purpose. Follow these practices to enhance clarity.
1. Use Descriptive Labels
Avoid abbreviations that are not universally understood. Instead of cust, use customer. If space is tight, use a legend, but standard names are always preferred.
2. Group Related Objects
Visually group objects that interact frequently. Use invisible containers or spacing to create clusters. This reduces the cognitive load required to trace relationships across the canvas.
3. Maintain Consistency
Ensure all object boxes are roughly the same size. Align text consistently. Inconsistent formatting distracts the reader and looks unprofessional.
4. Limit Complexity
If a diagram becomes too large, split it into multiple views. For example, one diagram for the User module and another for the Billing module. It is better to have two clear diagrams than one overwhelming one.
🌍 Real-World Use Cases
Where do these diagrams fit into the development lifecycle? They are versatile tools used across various stages.
1. Debugging Runtime Errors
When a bug occurs, you can model the state of the objects involved in the error. This helps in reproducing the issue and understanding why a specific link failed.
2. API Documentation
For external developers using your API, an object diagram can illustrate the expected payload structure. It shows how data objects relate to one another in a response.
3. Training New Team Members
Onboarding is easier with concrete examples. A class diagram shows theory; an object diagram shows practice. New hires can see how data flows through the system.
4. System Audits
During code reviews or architectural audits, object diagrams help verify that the implementation matches the design. They highlight discrepancies between the intended architecture and the actual runtime state.
🔄 Integration with Other UML Diagrams
Object diagrams do not exist in isolation. They complement other UML diagrams to form a complete documentation suite.
- Sequence Diagrams: Sequence diagrams show the flow over time. Object diagrams show the static state resulting from that flow. They work well together.
- State Machine Diagrams: State diagrams show how an object changes state. Object diagrams can show the configuration of objects within a specific state.
- Class Diagrams: The foundation. Every object in an object diagram must correspond to a class in a class diagram.
Using them in tandem ensures that your documentation covers both the design (structure) and the execution (behavior).
📊 Analyzing Relationships in Depth
Understanding the nuances of links is critical. Not all links are equal. Some represent ownership, others represent navigation.
Ownership Links
These indicate a strong relationship where one object manages the lifecycle of another. In an object diagram, this is often shown with a solid line, sometimes with a filled diamond at the source end. For example, a Project object might own several Task objects.
Navigation Links
These allow one object to access another. They do not necessarily imply ownership. For instance, a Driver object might navigate to a Car object, but the car can exist without the driver.
Aggregation vs. Composition
While these are class-level concepts, they manifest in object diagrams through the density and nature of links. Composition implies that if the parent object is destroyed, the child objects are also destroyed. Aggregation implies the child can exist independently.
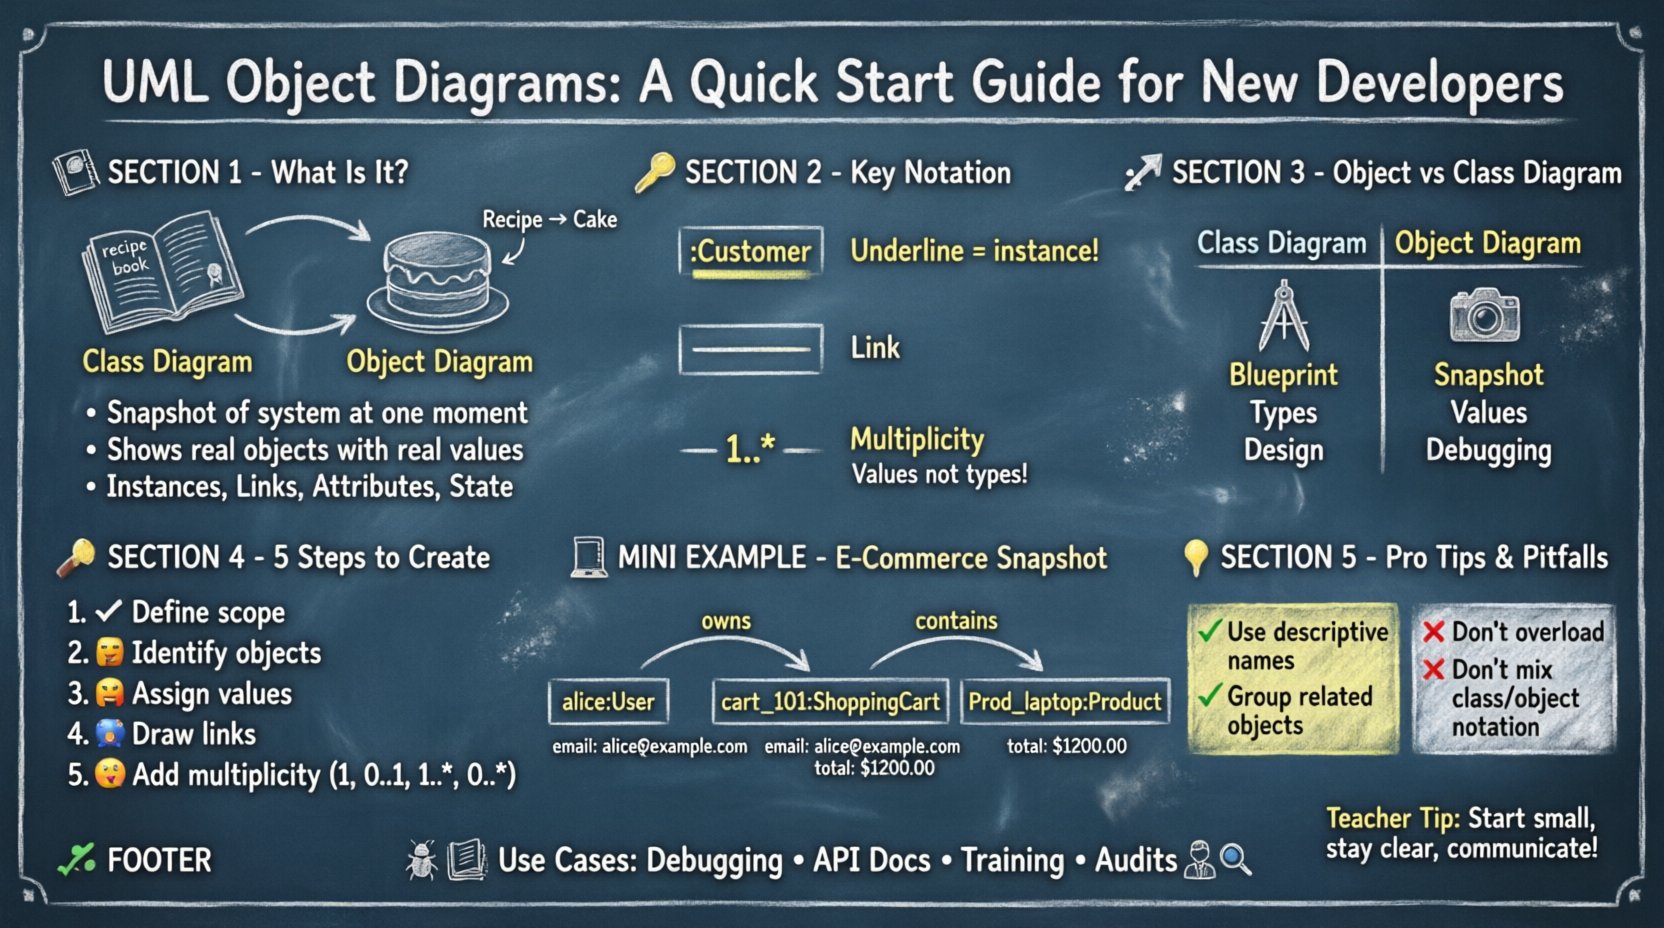
🧪 Example Scenario: E-Commerce System
Let us visualize a simple e-commerce scenario to see these concepts in action. Imagine a snapshot of a user browsing products.
Objects Involved:
:User(Instance:alice):ShoppingCart(Instance:cart_101):Product(Instance:prod_laptop):Order(Instance:order_55)
Relationships:
aliceownscart_101.cart_101containsprod_laptop.aliceplacedorder_55.
In the diagram, alice:User would have attributes like email: [email protected]. cart_101:ShoppingCart would have total: 1200.00. The lines connecting them would be labeled owns, contains, and placed respectively. This concrete view clarifies the data flow better than abstract class definitions alone.
🛡️ Security and Privacy Considerations
When sharing object diagrams, especially in documentation, be mindful of data sensitivity. Object diagrams often contain real or simulated data values.
- Anonymize Data: Do not use real names, phone numbers, or addresses in public diagrams. Use placeholders.
- Mask Sensitive Fields: If showing authentication tokens or passwords, mask the values (e.g.,
token: ******). - Internal Use Only: Mark diagrams containing detailed runtime data as internal. They may reveal logic that competitors could exploit.
🧭 Final Thoughts on Modeling
Building UML object diagrams is a skill that improves with practice. It requires a balance between technical accuracy and visual clarity. You are not just drawing boxes; you are documenting the reality of your software.
Start small. Pick a single feature. Model the objects involved. Verify that the links match your class definitions. As you become comfortable, expand to larger subsystems. Remember, the goal is understanding, not perfection. A diagram that is 80% accurate but clearly communicated is more valuable than a perfect one that no one can read.
Keep your notation consistent. Keep your labels descriptive. And always remember that these diagrams serve the team. If they help your colleagues understand the system faster, you have succeeded.
By mastering these diagrams, you enhance your ability to design robust systems and communicate complex ideas effectively. This foundation supports better code, fewer bugs, and smoother collaboration across the development lifecycle.