


Imagine needing to break down a complex project like a Warehouse Management System into manageable parts, but the sheer volume of requirements feels overwhelming. What if you could generate a structured, hierarchical diagram in seconds, not just to organize your thoughts, but to gain deep insights and interact with your data? The AI Tree Diagram Maker from Visual Paradigm Online is the answer. This powerful, AI-powered tool transforms the way you plan and analyze projects, turning complex information into an intuitive, visual, and interactive knowledge base. It’s not just a diagramming tool; it’s a collaborative thinking partner that helps you see the big picture and the fine details simultaneously.
At its core, the AI Tree Diagram Maker is an online platform designed to help users structure and analyze hierarchical data with ease. It features a unique dual-view interface, combining a simple text editor with a real-time visual diagram, making it incredibly fast to capture and organize your ideas. The tool’s true power lies in its intelligent AI features, which can generate entire diagrams from a single topic, analyze your data for potential risks, and allow you to ask questions about your project in plain English. This makes it an essential tool for anyone who needs to organize complex information, from project managers to business analysts and software architects.
How the AI Tree Diagram Maker Works: A Step-by-Step Guide
Let’s walk through a practical example using the AI Tree Diagram Maker. The process is designed to be intuitive and efficient, starting with a simple idea and building it into a detailed, data-rich plan.
Step 1: Generate Your Diagram with AI
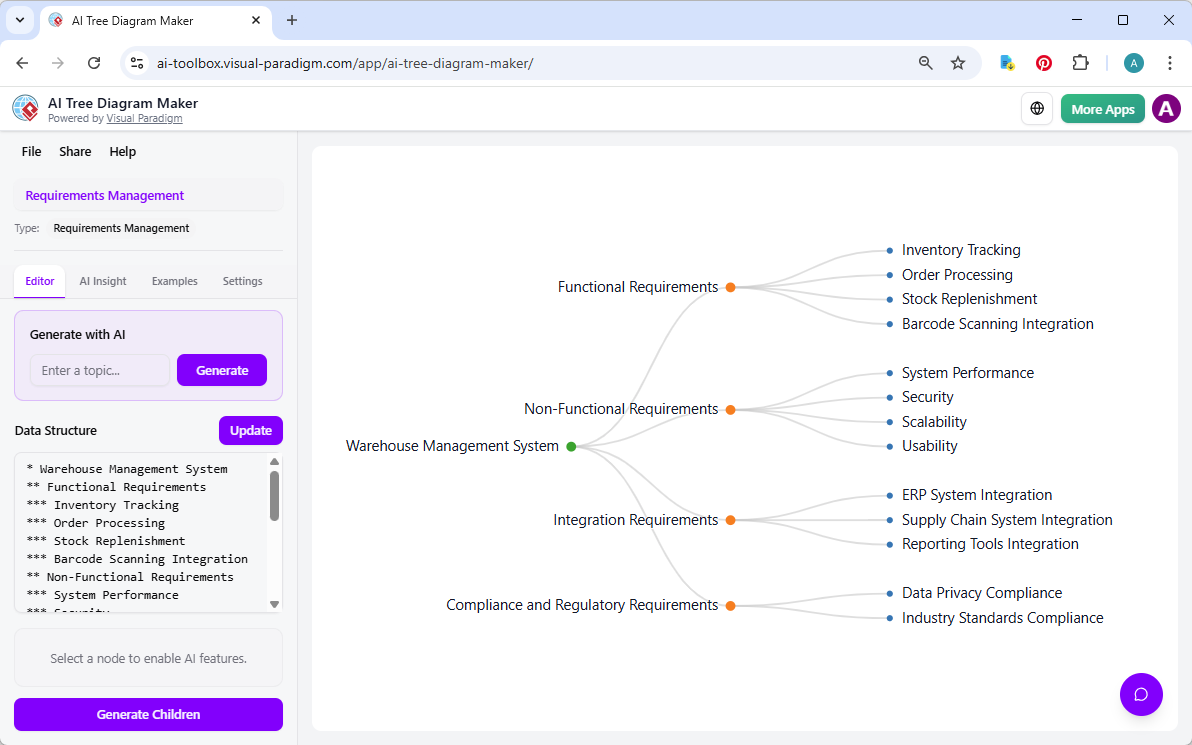
The journey begins with a single idea. In the AI Tree Diagram Maker, you can enter a topic like “Warehouse Management System” into the “Generate with AI” input box. By clicking the “Generate” button, the AI instantly creates a comprehensive tree structure. Image 1 shows the result: a clear, visual hierarchy with main branches like “Functional Requirements,” “Non-Functional Requirements,” and “Integration Requirements.” This powerful feature saves hours of manual brainstorming, providing a solid starting point for your project plan.
Step 2: Detail Your Nodes with Properties
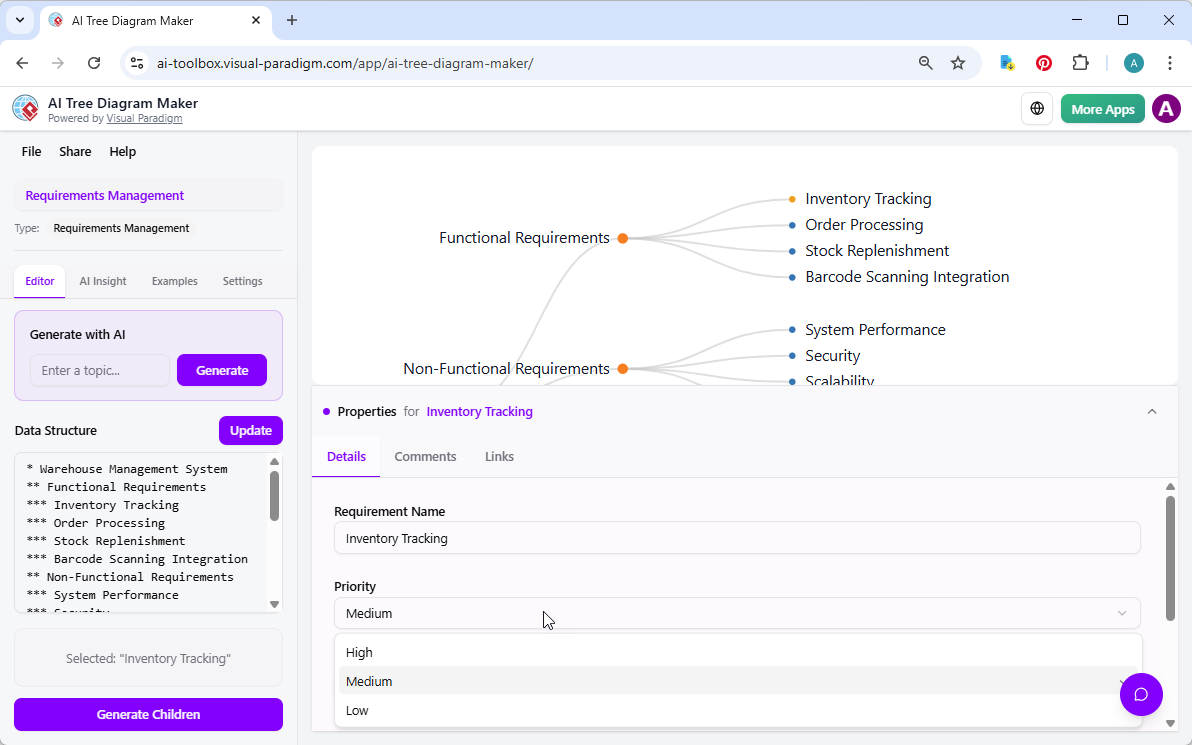
Once your high-level structure is in place, you can add crucial details to each node. The AI Tree Diagram Maker allows you to assign specific properties to each item in your tree. Image 2 illustrates this in action. When you select a node, such as “Inventory Tracking,” a property editor appears at the bottom. Here, you can set a “Priority” (e.g., High, Medium, Low), update the “Status” (e.g., To Do, In Progress, Done), add a “Comment,” or even link to external documents. This transforms your diagram from a simple outline into a rich, interactive project database, ensuring every task is tracked and understood.
Step 3: Engage with Your Data via AI Assistant
What if you need to understand a specific requirement in more depth? The AI Tree Diagram Maker includes a chatbot that acts as your personal project assistant. Image 3 shows the AI Assistant in action. After selecting the “Inventory Tracking” node, you can ask the AI a question like, “Describe the requirement in more detail.” The AI analyzes the context of your diagram and provides a written explanation, such as: “The requirement ‘Inventory Tracking’ is listed under Functional Requirements. It involves monitoring and managing stock levels in real time…” This feature allows you to quickly gain insights and ensure everyone on your team has a shared understanding of the project’s details.
![]()
Key Benefits of the AI Tree Diagram Maker
The AI Tree Diagram Maker offers a suite of powerful features that go far beyond simple diagramming. Here are the key benefits that make it a standout tool:
-
Accelerate Your Planning: The AI generation feature allows you to create a detailed project plan from a single topic in seconds, dramatically speeding up the initial planning phase.
-
Gain AI-Powered Insights: The AI Insight feature provides a written analysis of your entire diagram, highlighting potential risks, bottlenecks, and suggestions for improvement, acting as a second pair of eyes for your project.
-
Converse with Your Data: The AI chatbot enables you to ask questions about your project in plain English, making it easy to find information without manually navigating the tree structure.
-
Build with Confidence: The ability to define and edit properties for each node ensures your diagram is not just visual but also data-rich and actionable.
Who Can Benefit from This Tool?
The AI Tree Diagram Maker is designed for a wide range of professionals who need to organize information visually. Project managers can use it to create detailed Work Breakdown Structures (WBS). Business analysts can map out complex business processes and decision trees. Software developers can outline system architectures and feature dependencies. Writers and researchers can structure their documents and narratives. Students and educators can break down complex subjects for learning. The versatility of this tool makes it an essential asset for anyone dealing with hierarchical information.
Conclusion
Creating a comprehensive plan for a complex system like a Warehouse Management System doesn’t have to be a daunting task. The AI Tree Diagram Maker from Visual Paradigm Online empowers you to do it efficiently and effectively. By combining a simple text-based editor with powerful AI features, it allows you to generate, analyze, and interact with your data in a way that is both intuitive and insightful. Whether you’re a project manager, a business analyst, or a developer, this tool can help you structure your thoughts, uncover hidden risks, and ensure your team is aligned. The ability to generate a full diagram with AI, detail every node with properties, and query your data with a chatbot is a game-changer for visual planning.
Ready to transform your project planning? Try the AI Tree Diagram Maker today and experience the power of intelligent, visual organization. Try Now.
Related Links
Visual Paradigm offers an AI-powered tree diagram maker, which is designed to transform natural language descriptions into structured, professional hierarchical diagrams. These tools enable users to visualize complex hierarchical data instantly, covering a wide range of applications such as organizational charts, mind maps, and Work Breakdown Structures (WBS). Features like the Symbol tool further streamline the process by allowing users to rapidly convert hierarchical text into clean, editable diagrams through an intuitive editing interface. Additionally, the platform provides specialized support for decision trees, family trees, and risk registers, ensuring that users can effectively map outcomes, genealogy, or risk hierarchies.
-
AI Tree Diagram Maker – Visualize Hierarchical Data Instantly: An overview of the AI-driven tool that generates mind maps, org charts, and WBS diagrams from text descriptions.
-
From Text to Diagram: How Symbol Makes Hierarchy Editing Fast and Intuitive: A guide on using the Symbol feature to convert hierarchical text into editable tree diagrams.
-
Visualizing Complex Ideas with AI-Powered Tree Diagrams: An exploration of how AI-driven tree diagrams help break down complex concepts into clear visual structures.
-
Comprehensive Tutorial: Mastering the AI Tree Diagram Maker (IntelliTree): A detailed tutorial on transforming natural language into professionally formatted hierarchical diagrams using interactive visualization.
-
Risk Register Template with Tree Diagram Visualization: Details on using tree diagrams to visualize risk hierarchies and mitigation plans within a risk register.
-
Decision Tree Software for Visual Modeling: A resource for building and analyzing decision trees to improve structured problem-solving.
-
Family Tree Maker for Visual Documentation: A tool specifically designed for creating detailed genealogical structures with customizable relationships.
-
Free Tree Chart Tool – Visual Paradigm Smart Board: An intuitive, web-based platform for creating and customizing various hierarchical tree structures.