


Ever stared at a complex system architecture and thought, “I need to explain this, but my brain is melting”? Enter the PlantUML Deployment Diagram Builder, a super-powered web tool from Visual Paradigm that turns your spaghetti code into a clear, visual masterpiece. It’s like having a diagramming wizard who just needs you to tell it what to draw. With a simple form-based interface, you define your software components, hardware nodes, and network connections, and boom—your deployment diagram magically appears in real-time. No more wrestling with messy text syntax or dragging elements around. Just define, preview, and voilà! It’s the ultimate tool for architects, DevOps, and anyone who needs to show how their software actually runs in the real world. And the best part? It’s all done right in your browser—no sign-up, no login, just pure diagramming joy. Let’s dive into how this cool tool works and why it’s a game-changer for visualizing complex systems.
What is the PlantUML Deployment Diagram Builder?
Imagine you’re building a house. You need blueprints to show where the walls go, the plumbing, the electrical wiring, and how all the rooms connect. The PlantUML Deployment Diagram Builder is like that blueprint for your software system. It’s a web-based tool that helps you create detailed diagrams showing how your software components are deployed across physical hardware, servers, and networks. Instead of writing complex PlantUML code from scratch, you use simple forms to define your system’s parts—like servers, databases, and services—and the tool automatically generates the code and renders the visual diagram. It’s like a visual coding assistant that does the hard work for you. You can see your diagram update in real-time as you make changes, which is super helpful for catching errors and refining your design. Plus, you can save your work locally as a JSON file, so your architectural plans are always safe and secure on your computer.
How It Works: A Step-by-Step Guide
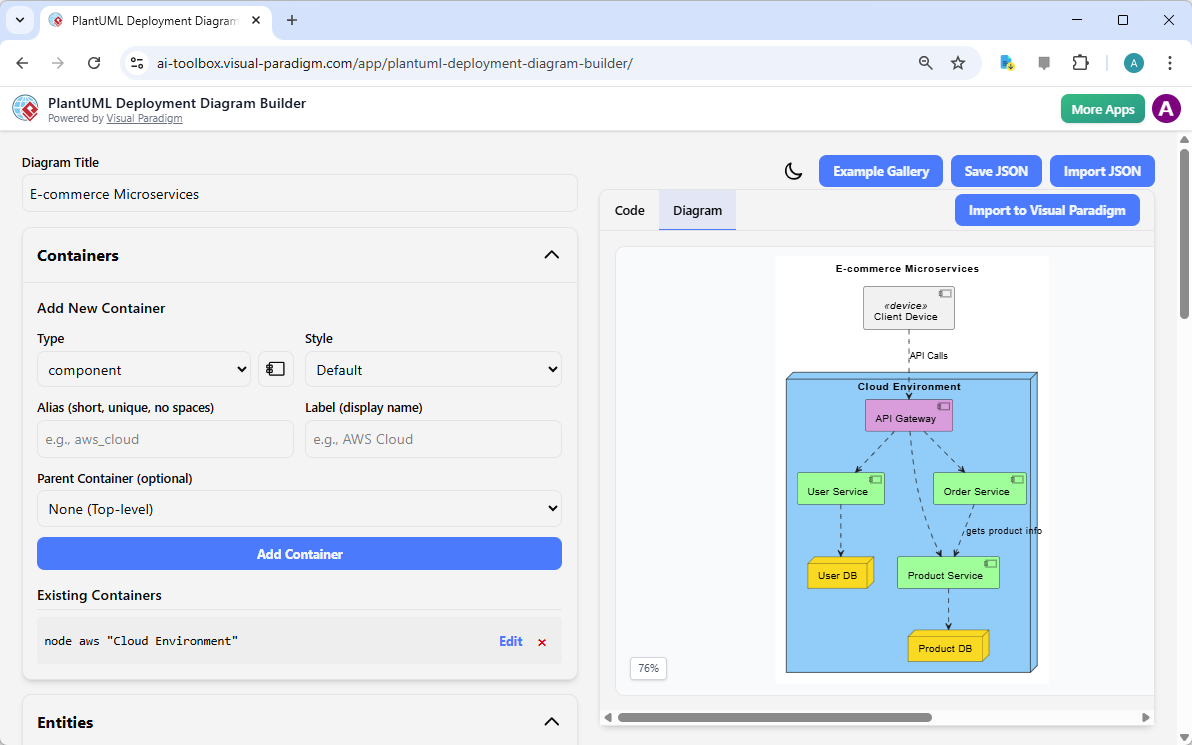
So, how do you actually use this amazing tool? It’s easier than you think! First, you start by giving your diagram a title—like “E-commerce Microservices.” Then, you add containers, which are like big boxes that hold your components. For example, you might create a container called “Cloud Environment” to represent your AWS setup. Inside that, you can add entities like “User Service” or “API Gateway.” The tool even lets you define relationships between these components, like “User Service –> API Gateway,” showing how they communicate. All this is done through intuitive forms on the left side of the screen. As you add and tweak things, the PlantUML code updates automatically in the output panel, and you get a live preview of your diagram on the right. It’s like having a real-time feedback loop for your architecture. You can also customize the look and feel by changing colors and styles to make your diagram more readable and professional.
Key Features That Make It Awesome
Let’s break down the cool features that make this tool stand out. First, the Structured Input Forms let you define entities and containers in a clean, organized way. No more guessing what the syntax should be—just fill out the forms and let the tool handle the rest. Then there’s the Live PlantUML Code Generation, which shows you the underlying code as you build. This is super useful for learning PlantUML syntax or verifying that your diagram is correct. The Live Visual Diagram Preview is another game-changer—every change you make instantly updates the visual, so you can see the impact right away. You can also use the Relationship Editor to define connections between components, which is crucial for showing how your system works. And don’t forget the Customizable Styling options, which let you apply different colors and styles to highlight important elements. Finally, the Local Save/Load Functionality ensures your work is safe and private, stored securely on your computer as a JSON file.
Real-World Use Cases
This tool isn’t just for tech geeks—it’s perfect for anyone who needs to visualize complex systems. For example, software architects can use it to document how their applications are deployed across different environments. DevOps teams can create diagrams to plan and communicate deployment strategies. System administrators can map out server configurations and network topologies. Students and educators can use it to learn about deployment diagrams and PlantUML syntax in a hands-on way. Even if you’re not a tech expert, you can use this tool to create clear, professional diagrams that help explain your system to others. It’s like having a universal language for system architecture.
Quick Summary
-
PlantUML Deployment Diagram Builder is a web-based tool for creating deployment diagrams using PlantUML syntax.
-
It uses intuitive forms to define entities, containers, and relationships, making it easy to build complex diagrams.
-
Features include live code generation, real-time visual preview, customizable styling, and local JSON file storage.
-
It’s ideal for software architects, DevOps teams, system administrators, and students.
-
Best for visualizing how software components are deployed across hardware and networks.
Ready to turn your complex system architecture into a clear, visual story? The PlantUML Deployment Diagram Builder is your go-to tool. It’s fast, intuitive, and incredibly powerful. Whether you’re documenting a web application, visualizing a microservices architecture, or just trying to make sense of your infrastructure, this tool will save you time and headaches. So why wait? Try it now and start building your first deployment diagram in minutes! 🚀
Related Links
A deployment diagram is a foundational UML tool used to visualize the physical distribution of software artifacts across various nodes, such as hardware or execution environments. Visual Paradigm provides an advanced toolset for these diagrams, featuring drag-and-drop modeling, real-time collaboration, and full integration with other UML standards. Modern architectural workflows are further enhanced by AI-powered generation for cloud applications and support for PlantUML code-based diagram construction.
-
What is a Deployment Diagram? – A Complete Guide to UML: An essential resource explaining the purpose, components, and best practices for modeling software system architecture.
-
Deployment Diagram Software Features – Visual Paradigm: An overview of capabilities including UML integration and collaborative features for professional modeling.
-
Deployment Diagrams in the Software Design Handbook: This guide offers practical insights into designing scalable and maintainable systems through structural deployment analysis.
-
Step-by-Step Deployment Diagram Tutorial: A hands-on tutorial that walks users through building diagrams from scratch, focusing on nodes, artifacts, and relationships.
-
Deployment Diagram Examples Gallery: A curated collection of real-world examples to inspire and guide system architecture modeling.
-
Free Online Deployment Diagram Tool: A web-based solution for creating professional deployment models instantly without software installation.
-
PlantUML Deployment Diagram Builder: A specialized integration that allows for code-based modeling and visualization using PlantUML syntax.
-
Creating Deployment Diagrams for Cloud Apps with AI: A technical guide on using AI-powered design to efficiently generate deployment diagrams for modern cloud infrastructures.
-
Beginner’s Guide to Deployment Diagrams: An introductory resource for those new to modeling system infrastructure and distribution.
-
Comprehensive Tutorial on Deployment Diagrams: An in-depth tutorial exploring the application of deployment diagrams in complex software engineering projects.