Introduction to SWOT Analysis
SWOT analysis is a strategic planning tool used to evaluate an organization’s internal strengths and weaknesses, as well as external opportunities and threats. Developed in the 1960s by Albert Humphrey at the Stanford Research Institute, this framework helps businesses, nonprofits, and individuals make informed decisions by identifying factors that impact their objectives.
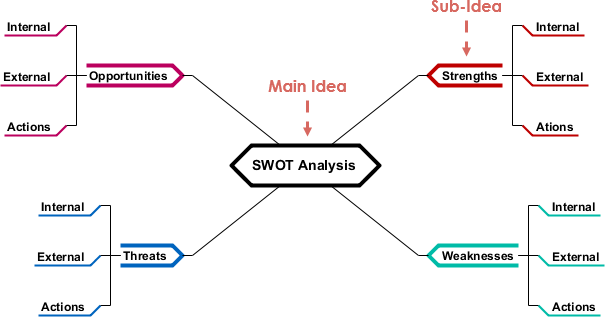
Core Components of SWOT Analysis
- Strengths: Internal advantages such as brand reputation, skilled workforce, or proprietary technology.
- Weaknesses: Internal limitations like outdated infrastructure, high debt, or poor customer retention.
- Opportunities: External factors for growth, including market trends, regulatory changes, or technological advancements.
- Threats: External risks like economic downturns, competitive pressure, or supply chain disruptions.
Conducting a SWOT Analysis
- Define an Objective: Focus on a specific goal, such as entering a new market or improving product quality.
- Gather Stakeholders: Include cross-functional teams to ensure diverse perspectives.
- Brainstorm Factors: Use guided questions to identify elements in each category.
- Strengths: What do you do better than competitors?
- Weaknesses: What areas need improvement?
- Opportunities: What external conditions could benefit you?
- Threats: What external elements could cause trouble?
- Prioritize Key Factors: Rank items by impact and feasibility to highlight actionable insights.
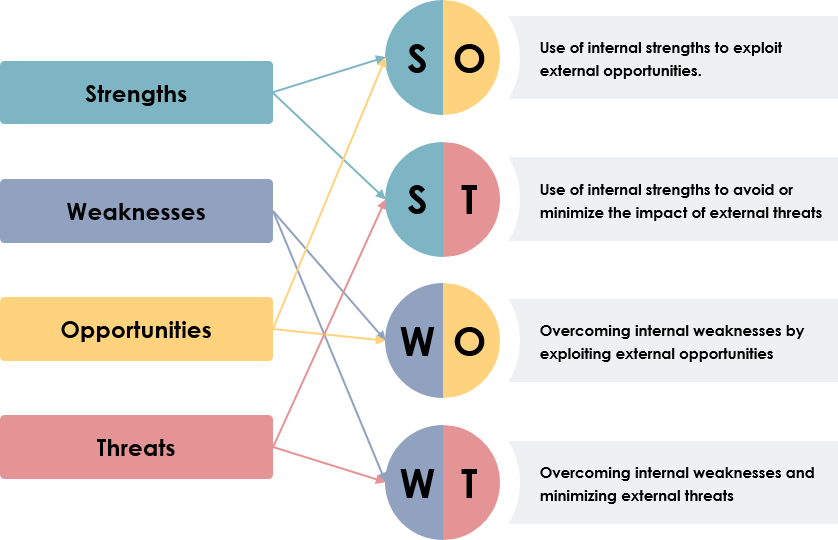
Strategic Applications
- SO Strategies: Leverage strengths to capitalize on opportunities.
- ST Strategies: Mitigate threats through strengths.
- WO Strategies: Convert weaknesses into opportunities.
- WT Strategies: Minimize weaknesses and threats defensively.
Benefits and Limitations
- Advantages: Offers a holistic view of internal and external factors, aids in risk management, and supports proactive planning.
- Criticisms: Can oversimplify complex issues, may reflect biases in data collection, and often lacks dynamic adjustments for changing environments.
Creating an Infographic with Visual Paradigm
Step-by-Step Guide
-
Sign Up and Log In:
- Go to the Visual Paradigm website.
- Sign up for an account if you don’t have one, or log in if you already do.
-
Create a New Project:
- Click on “Create New Project” and select “Infographic” from the available templates.
-
Design Your Infographic:
- Title: Add a title at the top, such as “SWOT Analysis Guide”.
- Sections: Divide the infographic into sections for each component of SWOT.
- Strengths: Use icons like a thumbs-up or a checkmark. List examples of strengths.
- Weaknesses: Use icons like a thumbs-down or a warning sign. List examples of weaknesses.
- Opportunities: Use icons like a lightbulb or a growth chart. List examples of opportunities.
- Threats: Use icons like a storm cloud or a danger sign. List examples of threats.
- Process: Include a flowchart or steps to conduct a SWOT analysis.
- Strategic Applications: Use arrows or connecting lines to show SO, ST, WO, and WT strategies.
- Benefits and Limitations: List the advantages and criticisms of SWOT analysis.
-
Customize Visuals:
- Use colors, fonts, and images that align with your brand or theme.
- Ensure the infographic is visually appealing and easy to read.
-
Review and Export:
- Review your infographic for accuracy and clarity.
- Export the infographic in your preferred format (e.g., PNG, PDF).
Example Layout
- Title: SWOT Analysis Guide
- Introduction: Brief explanation of SWOT analysis.
- Strengths Section:
- Icon: Thumbs-up
- Examples: Brand reputation, skilled workforce
- Weaknesses Section:
- Icon: Thumbs-down
- Examples: Outdated infrastructure, high debt
- Opportunities Section:
- Icon: Lightbulb
- Examples: Market trends, technological advancements
- Threats Section:
- Icon: Storm cloud
- Examples: Economic downturns, competitive pressure
- Process Section:
- Steps: Define objective, gather stakeholders, brainstorm factors, prioritize key factors
- Strategic Applications Section:
- SO, ST, WO, WT strategies with connecting lines
- Benefits and Limitations Section:
- Advantages: Holistic view, risk management
- Criticisms: Oversimplification, biases
By following this guide, you can create a comprehensive and visually engaging infographic on SWOT analysis using Visual Paradigm.


")


